May 2024
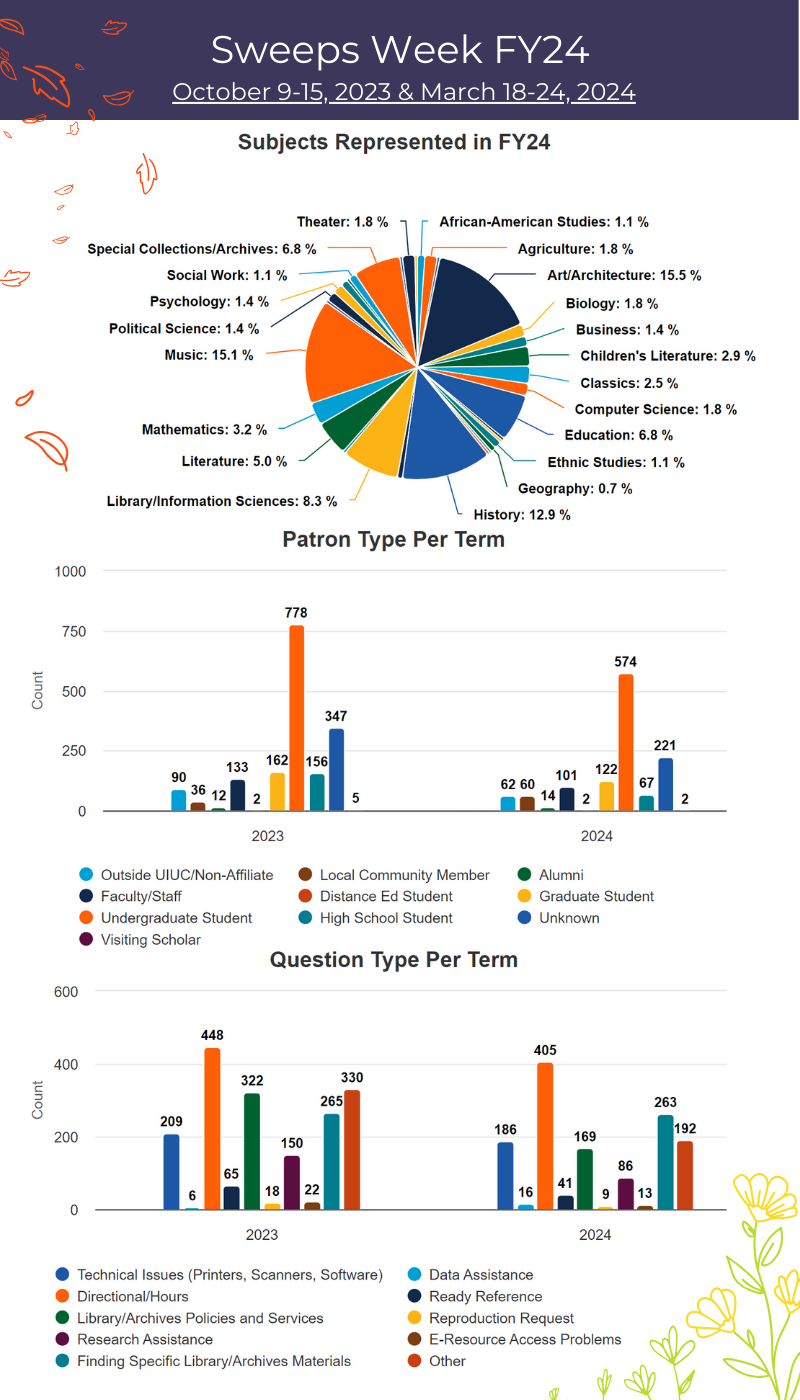
Sweeps Week is a semesterly event during which Library units put in extra effort to thoroughly collect data on visitor counts, reference interactions, and other metrics. These two events in Fall and Spring provide a snapshot of activity for units and the Library to evaluate the use of resources and facilities.
FY24 is the first year the desk stats have been tracked entirely in our LibInsight platform, and with every participating unit’s data on LibInsight we were able to gather their records together for a more comprehensive view of the Library during Sweeps Week.
5870 total records were created across the Fall and Spring events, tracking 123875 visitors in library spaces and 2112 reference transactions.
- Fall ran from October 9 to October 15, 2023. 3211 records were created tracking 67181 visitors and 1280 non-directional reference interactions.
- Spring ran from March 18 to March 24, 2024. 2659 records were created tracking 56694 visitors and 832 non-directional reference interactions.
Consolidating desk stats on LibInsight also gave us an opportunity to analyze the details of reference interactions more deeply than usual by comparing the core fields shared across all participating units. The varying functions of units means some use these fields more than others, and many units track additional metrics relevant to them, but we can still learn a bit more about who the Library serves and how we help them.
- Of the 2946 records that included Patron data, 45.9% of the FY24 total identified as undergrads. They were the clear majority of Library users in the Fall and Spring terms. After Other, graduate students were the third most common at 9.6%, indicating the Library primarily serves UIUC’s student population. However, all patron types were represented and when Visiting Scholars, Local Community Members, High School Students, and Outside UIUC/Non-Affiliate users are combined we see the Library has served at least 478 people outside the UIUC community in 2 weeks.
- 3215 records tracked the types of Questions users asked. The majority of reference questions asked were Directional/Hours questions at 26.5% across the year, but when patrons were sure about where and when they were they mostly asking for specific Library and Archives materials, making up 16.4% of the total records.
- Units collected 371 records that tracked the Subjects of users’ reference and research inquiries. Other was included in 107, 27.8%, of them. Art/Architecture, Music, and History were the next top three at 41, 40, and 36 entries respectively, although Library/Information Science muscled out Music in the Fall. The graph included here has filtered out Other to improve visibility of the diversity of subjects and the percentages are of the 264 non-Other entries. Some subjects are still unlabeled, including Environmental Science, Government Information, Health/Medical, Linguistics, Philosophy, Religion, Speech and Hearing Science, and Veterinary Medicine with 1 entry each.
It is important to keep in mind that these data give us a glimpse into how the Library is used, but also how we track that use. For example, the predominance of Art/Architecture and Music is because they have libraries dedicated to them in Ricker and MPAL, while most other units serve diverse research areas. The frequency of Other across many fields could indicate uncertainty about how reference data should be recorded, or it may be that a unit has internal metrics that provide more specificity. The numbers will only ever tell a part of the story, and it is important for us all to remain aware of our workplace and how we understand our users and bring our own insights into improving both.
The graphs were made using LibInsight’s Dashboards function, and and interactive versions along with other core fields can be found here: https://illinois.libinsight.com/sweepsweekfy24. Categories can be excluded from the column charts by clicking on their names in the legends or made to stand out in the pie charts by clicking on their name or their wedge.
April 2024
Grateful — Helpful — Encouraging — Accessible — Lifesaver
….
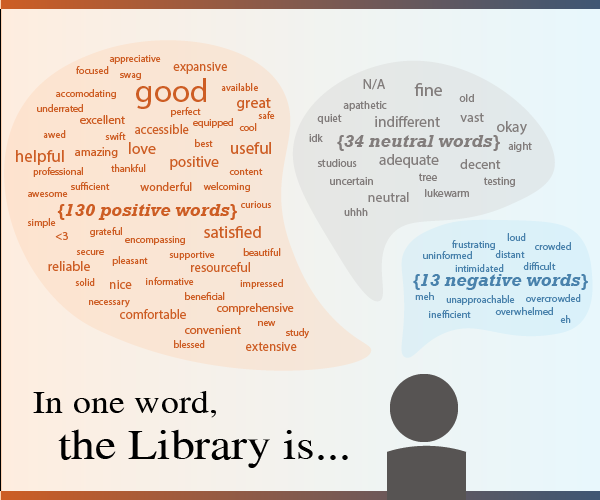
On the Spring 2024 Library Service Satisfaction Survey, we asked participants to describe how they feel about the University of Illinois Library in one word. Above are some of the words submitted by the survey participants.
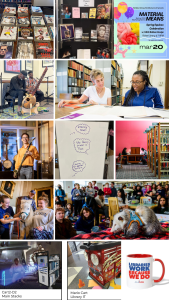
Tuesday, April 9, 2024 is National Library Workers Day (NLWD) and the April factoid is a collage of library memories. This is dedicated to (in alphabetical order) the 58 academic professionals, 149 civil service staff, 81 faculty (tenure-system and specialized), 77 graduate student assistants, and approximately 250 hourly workers (student hourly, academic hourly, graduate hourly & extra help) who created these memories for library users and the community.
Data from the Division of Management Information 2023-2024 Campus Profile – University Library (dmi.illinois.edu)
Images from
Instagram: @mpalillinois, @unihighlibrary, @commlibraryillinois, @rickerlibraryui, @illinois_iasl
X: @ILLINOISstacks
Image Database by Strategic Communications and Marketing at Illinois (stratcom.illinois.edu)
National Library Workers Day Publicity Tool Kit (www.ala.org/news/mediapresscenter/presskits/NLWDPubTools)
March 2024
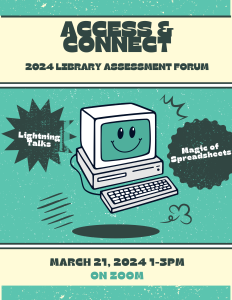
Save the data to connect with us at the virtual Assess and Connect: 2024 Library Assessment Forum! The forum will take place on Thursday, March 21st from 1-3pm on Zoom (registration link to follow). At the forum you will hear from colleagues about their assessment projects and will be able to participate in a spreadsheet workshop.
The forum is open to all library faculty, APs, Civil Service staff, graduate assistants and hourly employees.
February 2024
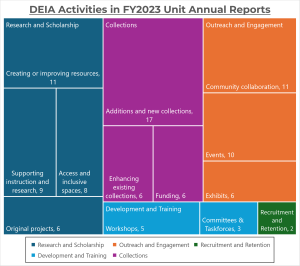
One of the noted strengths in the FY2023’s Unit Annual Reports was increased evidence of DEIA initiatives in the Library. In fact, we found a total of 103 reported activities and projects with the aim of cultivating an environment of diversity, equity, inclusion, and accessibility within the Library and for the communities we serve. That is a 47% increase from the 70 activities we found for FY2021 in our February 2022 factoid.
Since then the Library established five “pillars” as lenses through which to focus its DEIA efforts: Research & Scholarship, Outreach & Engagement, Recruitment & Retention, Development & Training, and Collections. The treemap above represents the 103 DEIA activities categorized by the pillars, which a color corresponding to each one and smaller sections for the general types of activities found within the category.
The activity count only includes those recorded in the Unit Annual Reports and does not comprehensively represent the Library’s DEIA efforts, and many activities supported more than one pillar but were assigned to the one they contributed to most for the chart.
Research and Scholarship was the most strongly represented with 35% of recorded activities primarily supporting inclusive access to and contributions to the Library’s scholarly resources.
Collection development remains a key area of DEIA activity, represented by 28% of activities. Units drew on DEIA Gap Fill funding and other sources to acquire new material for DEIA related areas of study and worked to improve discoverability of works by underrepresented groups in existing collections.
The graduate assistants among the Library’s units contributed significantly to DEIA initiatives, with 18% of recorded activities being credited to their efforts. They showed a creative streak as making research guides, digital content, and presentations were their most common activities.
Graphic created and text written by Gabriel Foster, Library Assessment Graduate Assistant. Thanks to Victor Jones, Jr. for feedback and insight into the Library’s DEIA activities and philosophy.
January 2024
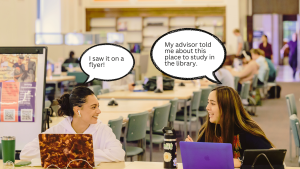
Did you know one of the most efficient ways for libraries to engage students is through their professors and advisors? In the Fall 2023 Library Service Satisfaction Survey, we asked the participants to indicate ways in which they learn about library services, resources and events. 41% of the participants said they learn through a professor or an advisor, and 38% from flyers, posters or digital displays. Surprisingly, less than 20% of the participants indicated that they learn about the libraries from their friends or from social media sites.
For more information about the Library Service Satisfaction Surveys, please contact Library Assessment (assessment@library.illinois.edu).
December 2023
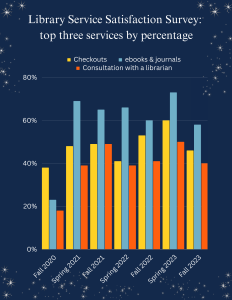
Since Fall 2020, Library Assessment has administered the “Library Services Satisfaction Survey” as a response to the rapidly changing circumstances of the pandemic and has continued as services and spaces have transformed. The results of the surveys have been used to understand students’ needs and usage of library services. With Fall 2023 as the 8th iteration of the survey, we were able to seen how students needs and usages have changed from the pandemic to now.
With the halting of in-person services students were not able to access our collections as easily as they were used to, nonetheless, the Library was able to pivot to make our resources such as e-books and e-journals accessible. This trend has continued as the Library returned to in-person services in Fall 2021 with the peak in Spring 2023 with 73% of students using e-resources. When students were able to access the building in Fall 2021 there was a 11% increase in check outs of books, equipment, or other library materials. Communicating virtually was not easy, especially from when the staff were working from home, but they were still able to answer 3,340 chats from “Ask a Librarian” during the Fall term in 2020. Even as the buildings reopened students continued to use services to consultation with librarians whether virtual or in-person.
Data collected from the Library Satisfaction Survey October 2020 to October 2023 and LibChat.
November 2023
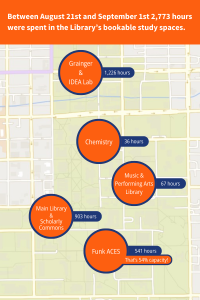
The new fall semester began on August 21st, and by the “10th” day of class, on September 1st, students started to settle in and find their place. While classes paused for the first weekend, the libraries did not and continuously provided students with space to explore, prepare, and relax for the full first twelve days. From the records of the study rooms booked through LibCal we can see they spent a total of 2,773 hours in library study areas across campus, or over 115 days in the libraries in less than two weeks.
On the first day of class, 19.5% of available hours were booked, and by September 1st, 28.6% of bookable hours had been occupied. The Funk ACES Library, in particular, was over half of its capacity at 54% during these first days. While the Main Library, including the Scholarly Commons Studios, hosted the most people at 415 unique users, the Grainger Engineering Library and the IDEA Lab had people stay the longest, for a total of 1226 hours. By the end of the first 12 days, every unit with study space available saw use.
Graphic created and text written by Gabriel Foster, Library Assessment Graduate Assistant.
October 2023
October is the National Arts & Humanities Month (NAHM). It was established by Americans for the Arts in 1993 with the goal to raise awareness and support for the arts and humanities across the nation.
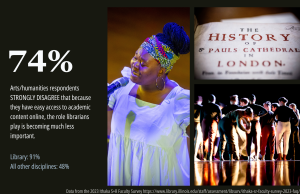
At the University, there is a strong connection between the Library and the arts and humanities. The 2023 Ithaka S+R Faculty Survey results showed that Illinois respondents who are involved in undergraduate instruction in arts and humanities are more likely to work with librarians on course materials, reading lists or syllabi than faculty in sciences and social sciences. More importantly, the arts/humanities respondents’ support for library buildings and staff are significantly higher than business, science or social science faculty. Over 70% of the arts/humanities faculty strongly disagree that because scholarly materials are available electronically that funding towards library buildings and staff should be reallocated to other needs.
For more information about the 2023 Ithaka S+R Faculty Survey, please visit the Library Surveys page or contact Library Assessment (assessment@library.illinois.edu).
September 2023
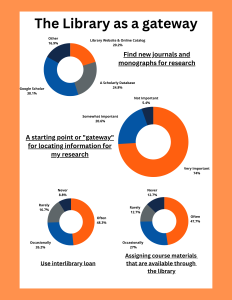
The Library is at the start of many research and learning opportunities for all patrons from students to faculty. The results of the 2023 Ithaka S+R Faculty Survey demonstrate that the library plays a role at the beginning of a researcher’s journey. 74% of the respondents rated the Library’s function as a “gateway” for locating information for their research to be “Very Important.” Most respondents use the library website and resources to search for new journals for their research as well as interlibrary loans or document delivery to find materials. This extends to choosing materials to use for an instructional course, where 47.7% of respondents gave preference to materials that were available through the library when designing a course.
A note about the data: A summary report of the 2023 Ithaka S+R Faculty Survey is available at https://www.library.illinois.edu/staff/assessment/libsurv/ithaka-sr-faculty-survey-2023-faq/.
Questions used in the infographic were:
- Q26 – How important is it to you that your college or university library provides each of the functions below or serves in the capacity listed below? [6 = extremely important; 1 = not at all important] – The library serves as a starting point or “gateway” for locating information for my research
- Q1 – When you explore the scholarly literature to find new journal articles and monographs relevant to your research interests, how do you most often begin your process? Select one of the following: – Visit my university library’s website or online catalog
- Q6 – When you want a scholarly monograph or journal article that you do not have immediate access to through your college or university library’s physical or digital collections, how often do you use each of the following methods to seek access to that material? – Use interlibrary loan or document delivery services provided by my library
- Q29 – In general, how often do you perform each of the following when designing or structuring your undergraduate courses? – Assigning course materials that are available through the library
May 2023
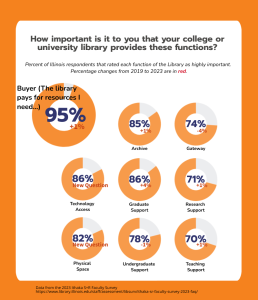
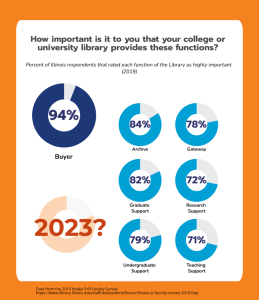
How do faculty, researchers and instructors value the roles the Library plays at the University? The results of the 2023 Ithaka S+R Faculty Survey show that the Library’s “Buyer” function is most valued (“The library pays for the resources I need, from academic journals to books to electronic databases”) – with 95% of the respondents rating this library function as highly important. This is consistent with the 2013 (93%) and 2019 (94%) results from the same survey. While the same trend have been consistently reported nationally (https://sr.ithaka.org/publications/ithaka-sr-us-faculty-survey-2021/), it is important to highlight that the percentage at Illinois was 11% higher than the national statistic (84%).
The 2023 survey included two new questions asking the respondents to rate the importance of “Technology Access” and “Physical Space.” Many Illinois respondents rated these functions to be very important. The “Technology Access” was rated as the second most important (86%; tied with the “Graduate Support” function after the “Buyer” function.
April 2023
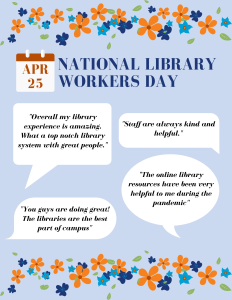
- “Overall my library experience is amazing. What a top notch library system with great people.”
- “Staff are always kind and helpful.”
- “You guys are doing great! The libraries are the best part of campus”
- “The online library resources have been very helpful to me during the pandemic”
Graphic created and text written by Virginia Haverstic, Library Assessment Graduate Assistant.
March 2023
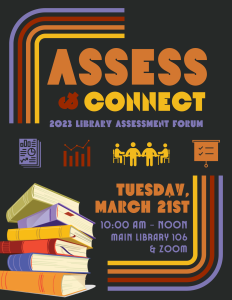
Curious about assessment in the Library? Want to know more about assessment projects and strategies? Mark your calendars to come connect with us in-person or online at Assess and Connect: 2023 Library Assessment Forum! The forum will take place on Tuesday, March 21st from 10 am to noon in Main Library 106 and on Zoom (registration link to follow).
The forum is open to all library faculty, APs, Civil Service staff, graduate assistants and hourly employees.
Graphic created and text written by Virginia Haverstic, Library Assessment Graduate Assistant.
February 2023
The Library is conducting the Ithaka S+R Faculty Survey from January 31 to February 28 (IRB Protocol Number 23438). This survey, developed by Ithaka S+R (https://sr.ithaka.org/), collects faculty, researchers and instructors’ practices and attitudes with respect to library services. The Library has conducted the same survey in 2013 and 2019. The 2023 survey results will be available in late Spring, 2023.
“The Role of the Library” is a key set of questions of this survey. These questions ask participants to rate the importance of the following library functions:
- The library serves as a repository of resources—in other words—it archives, preserves, and keeps track of resources (Archive)
- The library pays for the resources I need, from academic journals to books to electronic databases (Buyer)
- The library serves as a starting point or “gateway” for locating information for my research (Gateway)
- The library supports graduate students in conducting research, managing data, and publishing scholarship (Graduate Support)
- The library provides an informal academic environment and space that supports student learning (Physical Space)
- The library provides active support that helps to increase the productivity of my research (Research Support)
- The library supports and facilitates my teaching activities (Teaching Support)
- The library provides access to technology resources that support student learning (Technology Access)
- The library helps undergraduates develop research, critical analysis, and information literacy skills (Undergraduate Support)
This infographic shows how the Illinois participates rated these functions in 2019. 94% of the participants view the Library’s “buyer” role to be important. A FAQ for the survey administration can be found at (https://www.library.illinois.edu/staff/assessment/libsurv/ithaka-sr-faculty-survey-2023-faq/). The 2013 and 2019 survey results can be found on the Library Assessment website (https://www.library.illinois.edu/staff/assessment/libsurv/).
Graphic created and text written by Jen-chien Yu.
January 2023
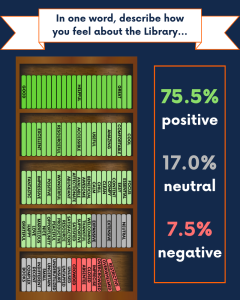
In October 2022, Library Assessment sent out the annual Library Service Satisfaction Survey asking students, faculty, and staff to rate the quality of library services. Question 15 requested respondents to describe how they feel about the Library in one word.
There were 107 answers to this question, but we chose to exclude one from the dataset due to its inappropriate nature. Of the remaining 106, 80 were positive, 18 were neutral, and 8 were negative. The most common positive response was “good” (11), the most common neutral responses were “expansive” (3) and “extensive” (3), and the most common negative response was “crowded” (2). In the graphic, each book on the shelf represents a response. Alongside volume count, higher color saturation indicates higher frequency of a word.
Graphic created and text written by Virginia Haverstic, Library Assessment Graduate Assistant.
December 2022
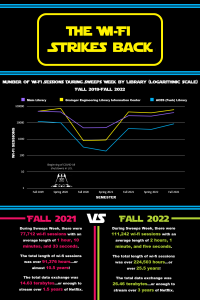
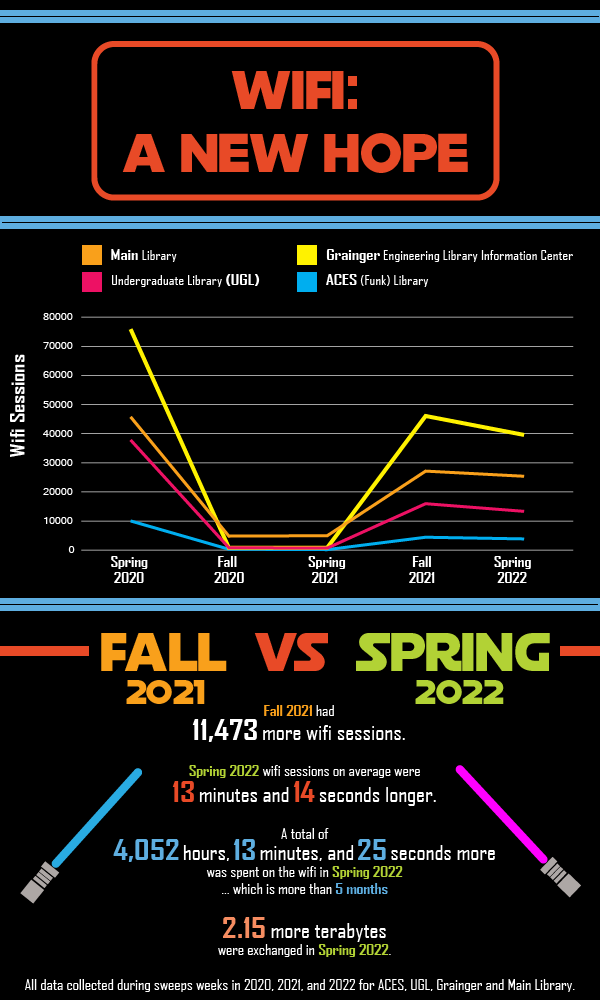
A short time ago in campus libraries not very far away at all, Fall 2022 Sweeps Week (October 17–23, 2022) took place. Sweeps Week is a semesterly event during which Library Assessment, with the help of librarians and staff across campus, gathers data with which to evaluate the use of library resources and facilities. This factoid concerns wi-fi use in the Main, Grainger, and ACES libraries during Sweeps Week. It follows two previous installments of Sweeps Week wi-fi analysis: November 2021 and April 2022.
The graph represents the number of wi-fi sessions by library during Sweeps Weeks in the semesters between fall of 2019 and fall of 2022. A wi-fi session occurs when a library patron’s device – smartphone, computer, game console, etc. – connects to the library wi-fi. During Fall 2022 Sweeps Week, wi-fi sessions in the Main, Grainger, and ACES libraries were more numerous than they had been since Spring 2020 Sweeps Week.
The direct comparison of Fall 2021 (October 11–17, 2021) and Fall 2022 Sweeps Weeks in the bottom part of the graphic demonstrates that not only were there more wi-fi sessions overall in fall of 2022, but that these sessions were longer both on average and in total. Additionally, data exchange in 2022 was nearly double data exchange in 2021. This data is from the Main, Grainger, and ACES libraries only.
Graphic created and text written by Virginia Haverstic, Library Assessment Graduate Assistant. Wi-fi data provided by Library IT, Chuck Hayes, and Uros Marjanovic.
November 2022
November is National Native American Heritage Month.
The University is on the lands of the Peoria, Kaskaskia, Piankashaw, Wea, Miami, Mascoutin, Odawa, Sauk, Mesquaki, Kickapoo, Potawatomi, Ojibwe, and Chickasaw Nations. These lands were the traditional territory of these Native Nations prior to their forced removal; these lands continue to carry the stories of these Nations and their struggles for survival and identity.
As a land-grant institution, the University of Illinois has a particular responsibility to acknowledge the peoples of these lands, as well as the histories of dispossession that have allowed for the growth of this institution for the past 150 years. We are also obligated to reflect on and actively address these histories and the role that this university has played in shaping them. This acknowledgement and the centering of Native peoples is a start as we move forward for the next 150 years.
– Land Acknowledgement Statement suggested by the Native American House
Known languages spoken by these Nations include Miami-Illinois, Algonquian, Ojibwa, Fox, Potawatomi, and Chickasaw.
The Library Catalog indicates the languages of its holdings using the MARC Code List for Languages. The Library holds items organized under 435 unique MARC language codes. The MARC standards group the Miami-Illinois, Algonquian, Fox, and Potawatomi languages under “Algonquian (Other)” and the Chickasaw language under “North American Indian (Other).”
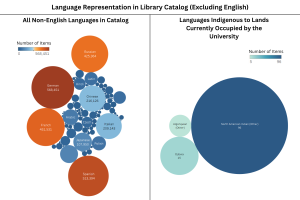
The bubble chart to the left shows language representation in the Library Catalog (excluding English). The top three non-English languages in the collection are German (568,451 items), Spanish (513,394 items), and French (451,531 items). As the bubbles representing items in the languages indigenous to the area occupied by the University are much too small to see, the chart to the right indicates their representation relative to one another.
“North American Indian (Other)” includes the Alabama, Arikara, Atsugewi, Beothuk, Chickasaw, Chimariko, Chitimacha, Chumash, Coahuilteco, Cocopa, Coos, Eastern Pomo, Eyak, Hualapai, Karok, Keres, Kiliwa, Konomihu, Kuitsh, Kumiai, Maidu, Mikasuki, Miwok, Mutsun, Nez Percé, Northern Sierra Miwok, Ohlone, Paipai, Pawnee, Shoshoni, Southeastern Pomo, Timucua, Tlakluit, Tonkawa, Tunica, Wappo, Wichita, Wikchamni, Wintu, Wiyot, Yahi, Yakama, Yuchi, and Yukiz languages. The Library Catalog records a total of 95 items in these languages.
The Library Catalog records 15 items in Ojibwa.
“Algonquian (Other)” includes the Abenaki, Algonquin, Atakapa, Atikamekw, Fox, Gros Ventre, Illinois, Kickapoo, Mahican, Massachuset, Menominee, Miami, Mohegan, Montagnais, Naskapi, Passamaquoddy, Penobscot, Potawatomi, Powhatan, Quileute, Roanoak, Shawnee, Wampanoag, and Yurok languages. The Library Catalog records a total of 5 items in these languages.
Graphic created and text written by Virginia Haverstic, Library Assessment Graduate Assistant. The item count by language includes only bibliographic records in Alma (a library services platform), and it does not represent all library collections.
October 2022
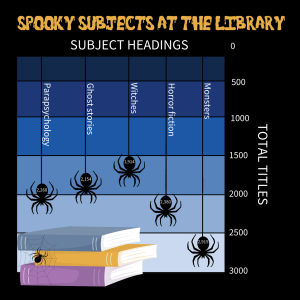
We can’t promise haunted tomes bound in human skin, but the Library’s collection is full of books that will twist your mind, haunt your thoughts, and bedevil your senses. This October, consider sampling from the plethora of options within the subject headings in the above graphic.
For even more fascinating frights, check out these collection highlights of illustrated horror from Mara Thacker, our South Asian Studies and Global Popular Culture Librarian:
Ghosts of India: Horror Comics Anthology
The Book of Indian Ghosts by Riksunder Banerjee, illustrated by Raka Chowdhury
Uzumaki: Spiral into Horror by Juji Itō, translated by Yuji Oniki
Graphic created and text written by Virginia Haverstic, Library Assessment Graduate Assistant. Mara Thacker provided collection highlights. Michael Norman provided collection statistics.
September 2022
Which of the following questions did you answer most during the first week of class? Was it …
“Where can I find a place to study?”
“How can I use the printer?”
“Where is Room 66?”
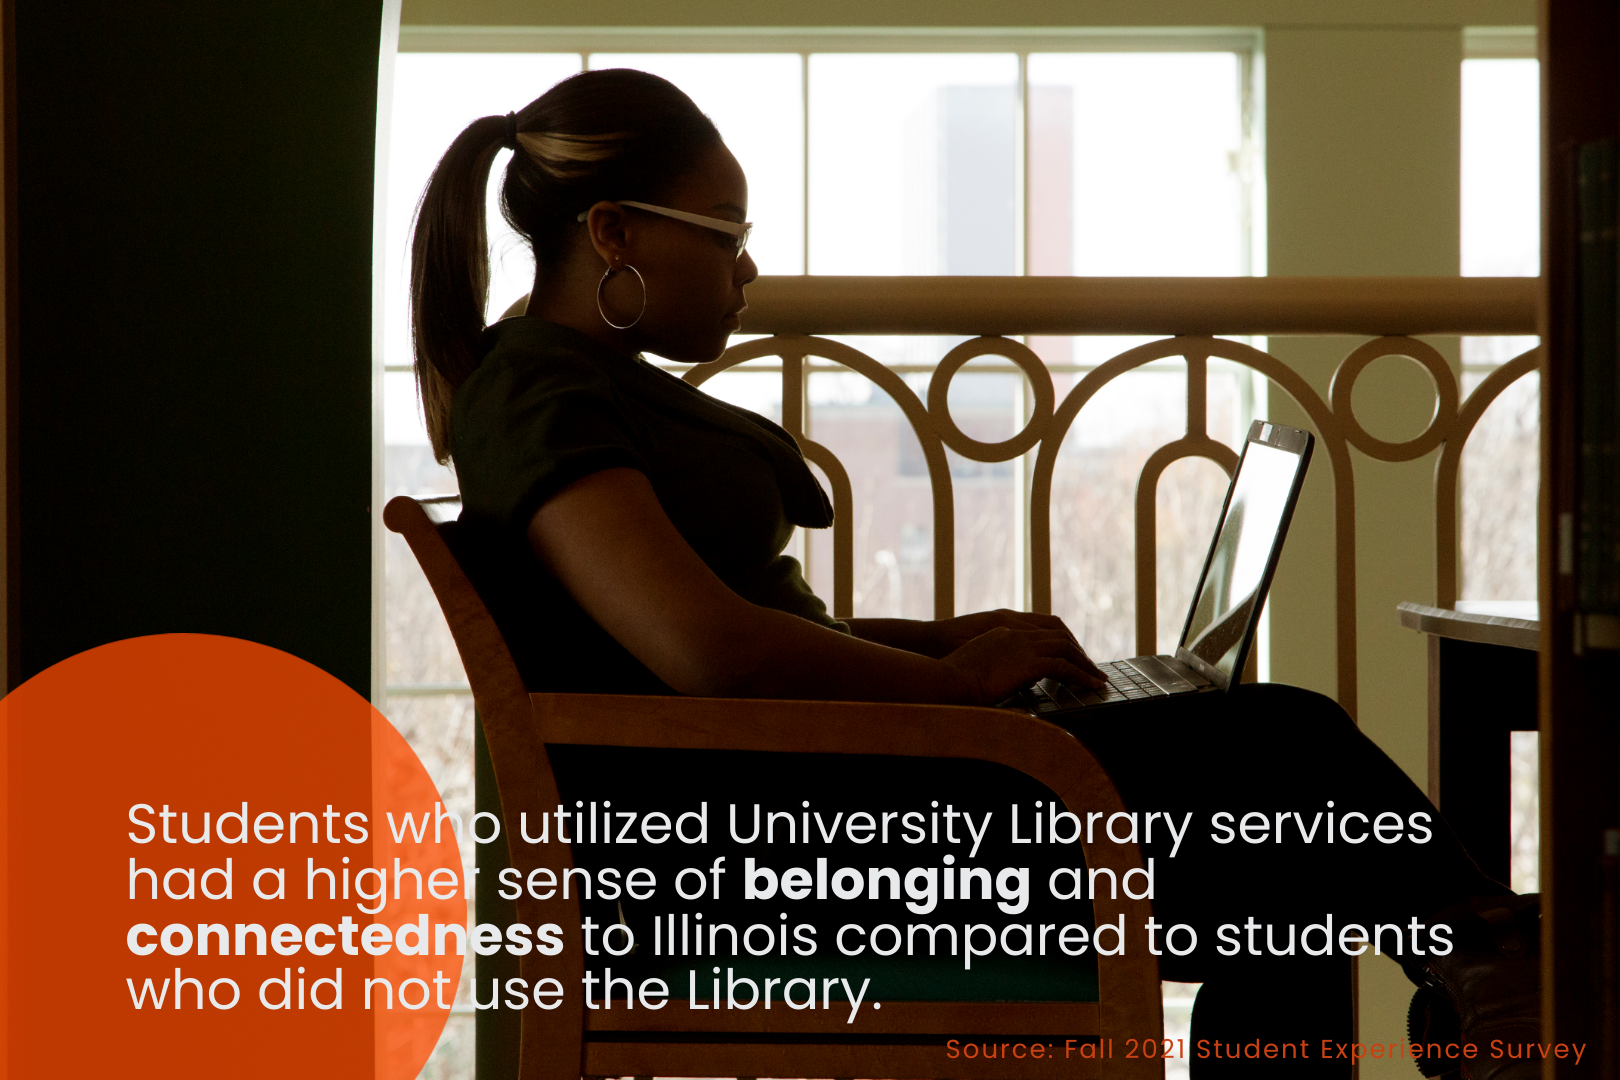
No matter how simple these questions are, the effort we make to help students navigate library buildings and services is important. The University’s Student Experience Survey (Fall 2021) found that students who used library services had a higher sense of belonging and connectedness to the University. An undergraduate student survey conducted by the Library (Fall 2018) also found that students who used library space “once or twice a year” reported higher GPA than those who had never been to a library on campus.
Thanks to Beth Hoag, Ph.D. for providing the Student Experience Survey findings. For more information about these studies, please contact Library Assessment (assessment@library.illinois.edu).
No factoid published in June, July and August 2022.
May 2022
The University Library couldn’t serve the campus and the diverse user population without our graduate student assistants and graduate hourly employees. Many of them are graduating in May, including the Library Assessment Graduate Assistant Lindsay Taylor who is the creator of many of the “Do you know?” Library Assessment Factoids during the past two years. As a farewell, we invited Lindsay to create a factoid of her choice. Happy Graduation Lindsay!
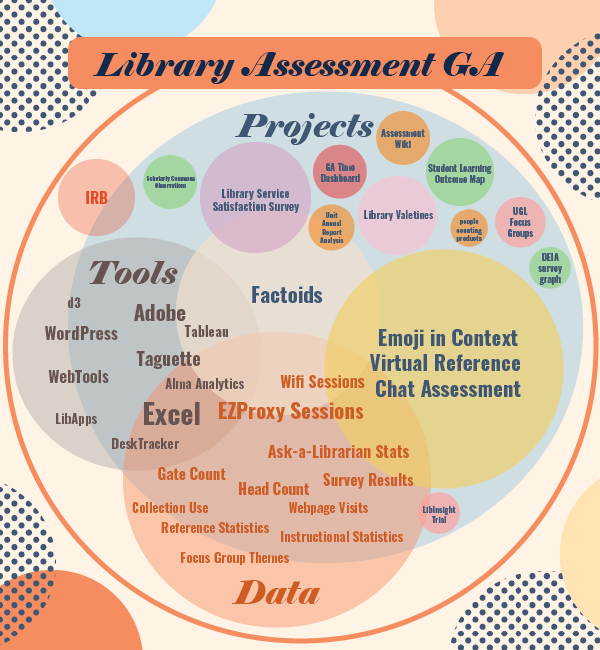
As the last factoid before graduating and ending my time as the Library Assessment GA, I created a circle packing visualization of my work over the past two years from my work log. It can be difficult to describe what one does, but this graph shows my experience of library assessment in overlapping rings of the tools, data, and projects where I spent the most time. My supervisor Jen-chien Yu told me when I applied to be the Library Assessment GA that loving spreadsheets is key to enjoying this role and that’s true: I spent almost 200 hours in Excel alone! My favorite part of this assistantship was creating factoids – like this one! Factoids usually start in Excel, sometimes moving over to Tableau for ideas. I analyze and graph the data we have collected to find the underlying story. That story becomes the core of the factoid. Then comes the fun part of adding colors, shapes, and more! Though I’ve always been a creative person, making these factoids has been a rewarding challenge for me to work with a variety of data (qualitative and quantitative), to pull a clear message from the data, and to communicate visually.
April 2022
As a follow-up from our Return of the WiFi factoid of November 2021, Wi-Fi usage is on the rise from where it was in Spring 2021. Usage statistics like Wi-Fi tend to be lower in spring semesters than fall semesters generally. However, even though there were less Wi-Fi sessions this past Spring, more time in total was spent on the Wi-Fi, transferring more bytes than in Fall semester! All data represents use during Sweeps Weeks (as opposed to the whole semester).
Image and text created by Lindsay Taylor (Library Assessment Graduate Assistant). The data analysis and visualization of Wi-Fi usage would not be possible without assistance provided by Library IT and Chuck Hayes and Uros Marjanovic at Technology Services.
March 2022
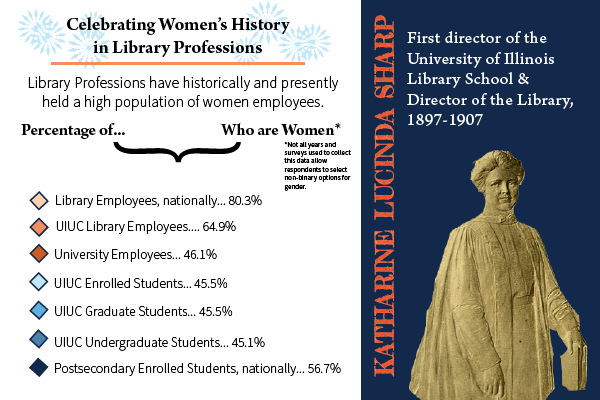
March is Women’s History Month and we thought we would use this to highlight the role of women at the University Library. Did you know that as of 2021, 65% of the library staff (including Academic Professional, Civil Service, and Faculty) is comprised of those who identify as women. Across campus that number is only 47% which is around the same number as students enrolled in undergraduate and graduate education.
A note regarding data timelines: UIUC statistics are an average of the past ten years (starting with academic year 2012-2013), while national data was collected from The National Center for Education Statistics (NCES). National enrollment and post-secondary employment statistics are from the most recent data tables from academic year 2019-2020.
Bonus Historical Factoid: Katherine Lucinda Sharpe was Director of the Library from 1897-1907. Read more about her and the first “Lady Librarians” here.
Image created by Lindsay Taylor (Library Assessment Graduate Assistant). Text written by Belinda Bolivar (Library Assessment Specialist) and Lindsay Taylor.
February 2022
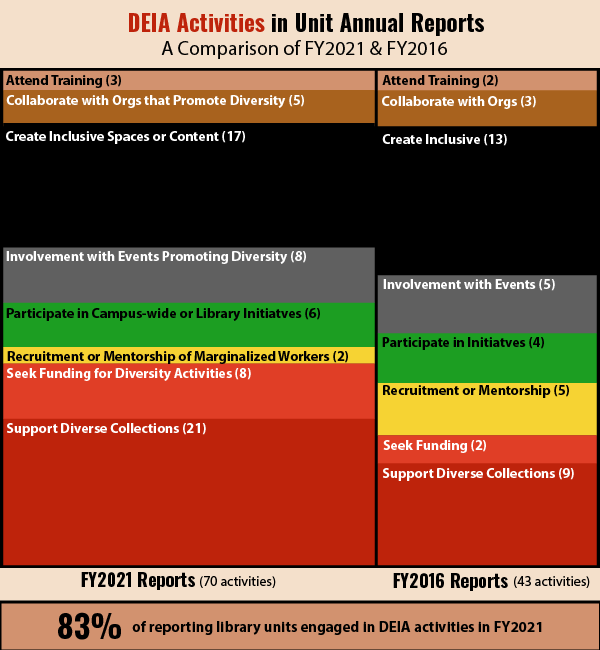
In celebration of Black History Month, we collected data about DEIA activities in each unit from the Unit Annual Reports. The data collected from the reports are by no means a conclusive list of all the DEIA-focused activities going on in the library. However, the unit annual reports provided a snapshot of each unit’s efforts over the years. We counted any project or goal mentioned in each report that aimed to increase diversity, equity, inclusion, or accessibility in the library’s spaces, collections, programming, online content, or endeavors. Each contribution to DEIA counted as one activity. Examples of DEIA activities include unit staff attending pronoun training, collecting newspapers of marginalized communities, creating an anti-racist plan, collaborating with the culture houses on campus, creating accessible spaces, and more!
In five years, the number of DEIA activities in the annual reports have nearly doubled throughout the library. There are many ways each unit works towards this goal in their respective areas and the initiatives have been grouped very generally in this Marimekko chart. In FY2021, the top categories are: supporting diverse collections (30% of FY2021 initiatives), followed by creating inclusive spaces or content (24%).
January 2022
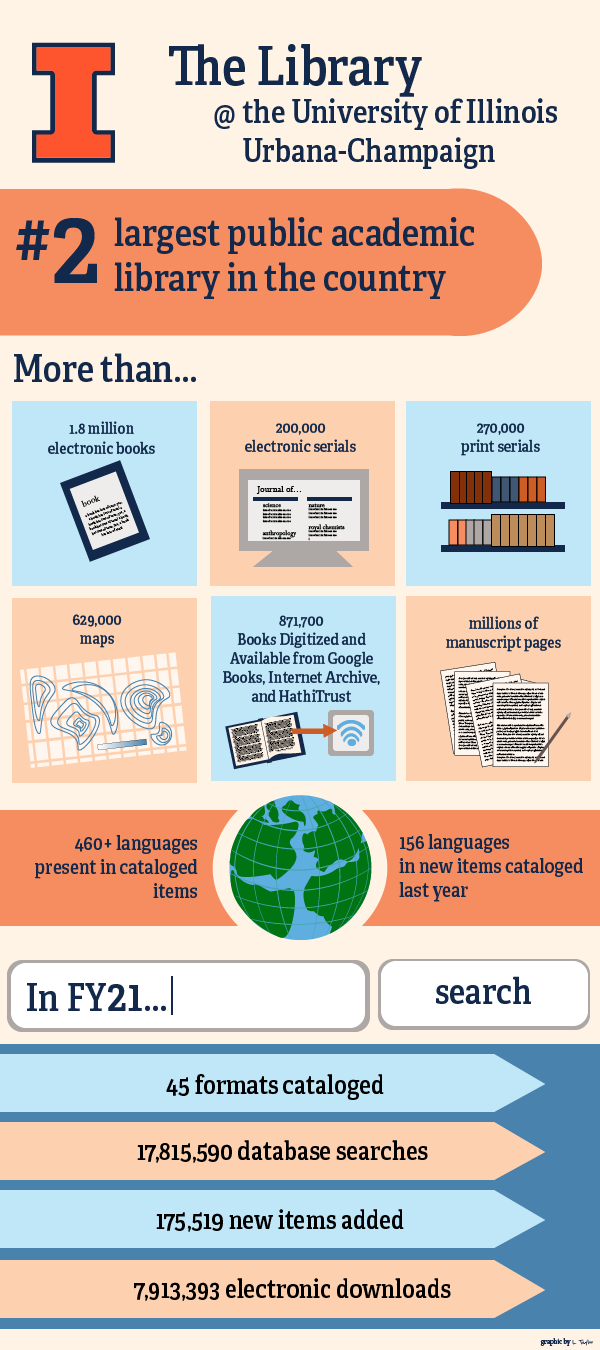
Do you know that the Library is the second-largest U.S. public academic library among Association of Research Libraries (ARL) in collection size?
Thanks to Acquisitions and Cataloging Services, Map Library, Esra Coskun, and Michael Norman for providing the statistics in this factoid. Image created by Library Assessment Graduate Assistant Lindsay Taylor.
December 2021
During November 2021, Library Assessment sent out the fourth Library Service Satisfaction Survey. The survey started in October/November 2020 and was sent again in March 2021. Each survey is similarly formatted and aims to assess students’ needs and attitudes towards library services. You can view factoids about the data collected in earlier surveys:
- November 2020: The Most Used Library Services in October 2020
- February 2021: Fall Semester 2020 Respondent Course Modality & Library Use, plus Survey Comments
- May 2021: Spring 2021 Library Service Satisfaction Survey Fast Facts
The November 2021 Library Service Satisfaction Survey received 177 responses. One new question in this iteration asked “In one word, describe how you feel about the library.” The responses to that question are represented in this factoid. The size of the word represents its frequency as an answer. 74% of one-word responses were positive (by our classification), 19% neutral, and 7% negative. The one-word response gauges the temperature of user perception. Another new question to this survey was “What would you like to see at the Library?” Over 70 responses to that question will lead to more detailed, granular suggestions that will be passed on to several library project teams so they can make decisions with user feedback in mind.
November 2021
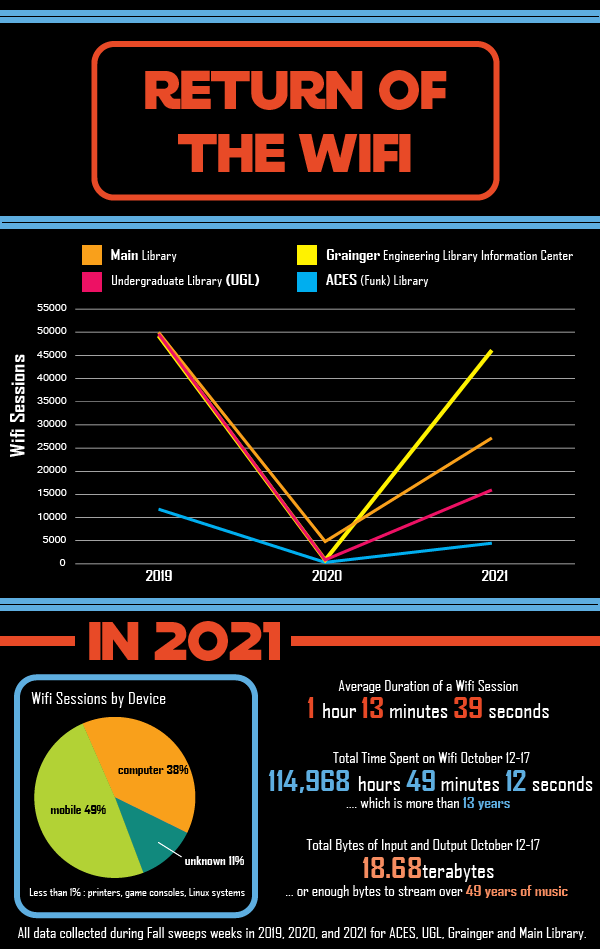
“A long time ago in a galaxy far, far away….”
The pre-pandemic life could seem like a long time ago when there were no social distancing and indoor restrictions. The Wi-Fi usage at the Library was down significantly during the 2020-2021 academic year because of limited capacity at library buildings and spaces. However, Wi-Fi usage is back on the rise this fall. During the Sweeps Week (October 11-17), 93,635 Wi-Fi sessions (when a user’s device such as a computer or a cell phone connects to the Wi-Fi network) were initiated in ACES (Funk) Library, Grainger Engineering Library Information Center, Main Library and Undergraduate Library. Averagely, a Wi-Fi session lasts 1 hour and 13 minutes – and altogether 114,968 hours and 49 minutes (more than 13 years) were spent on the Wi-Fi between October 11-17. In that one week, enough data came over the Wi-Fi to stream 49 years of music! (Music streaming years were calculated at a normal quality — or as Spotify puts it: 96kbits/sec).
October 2021
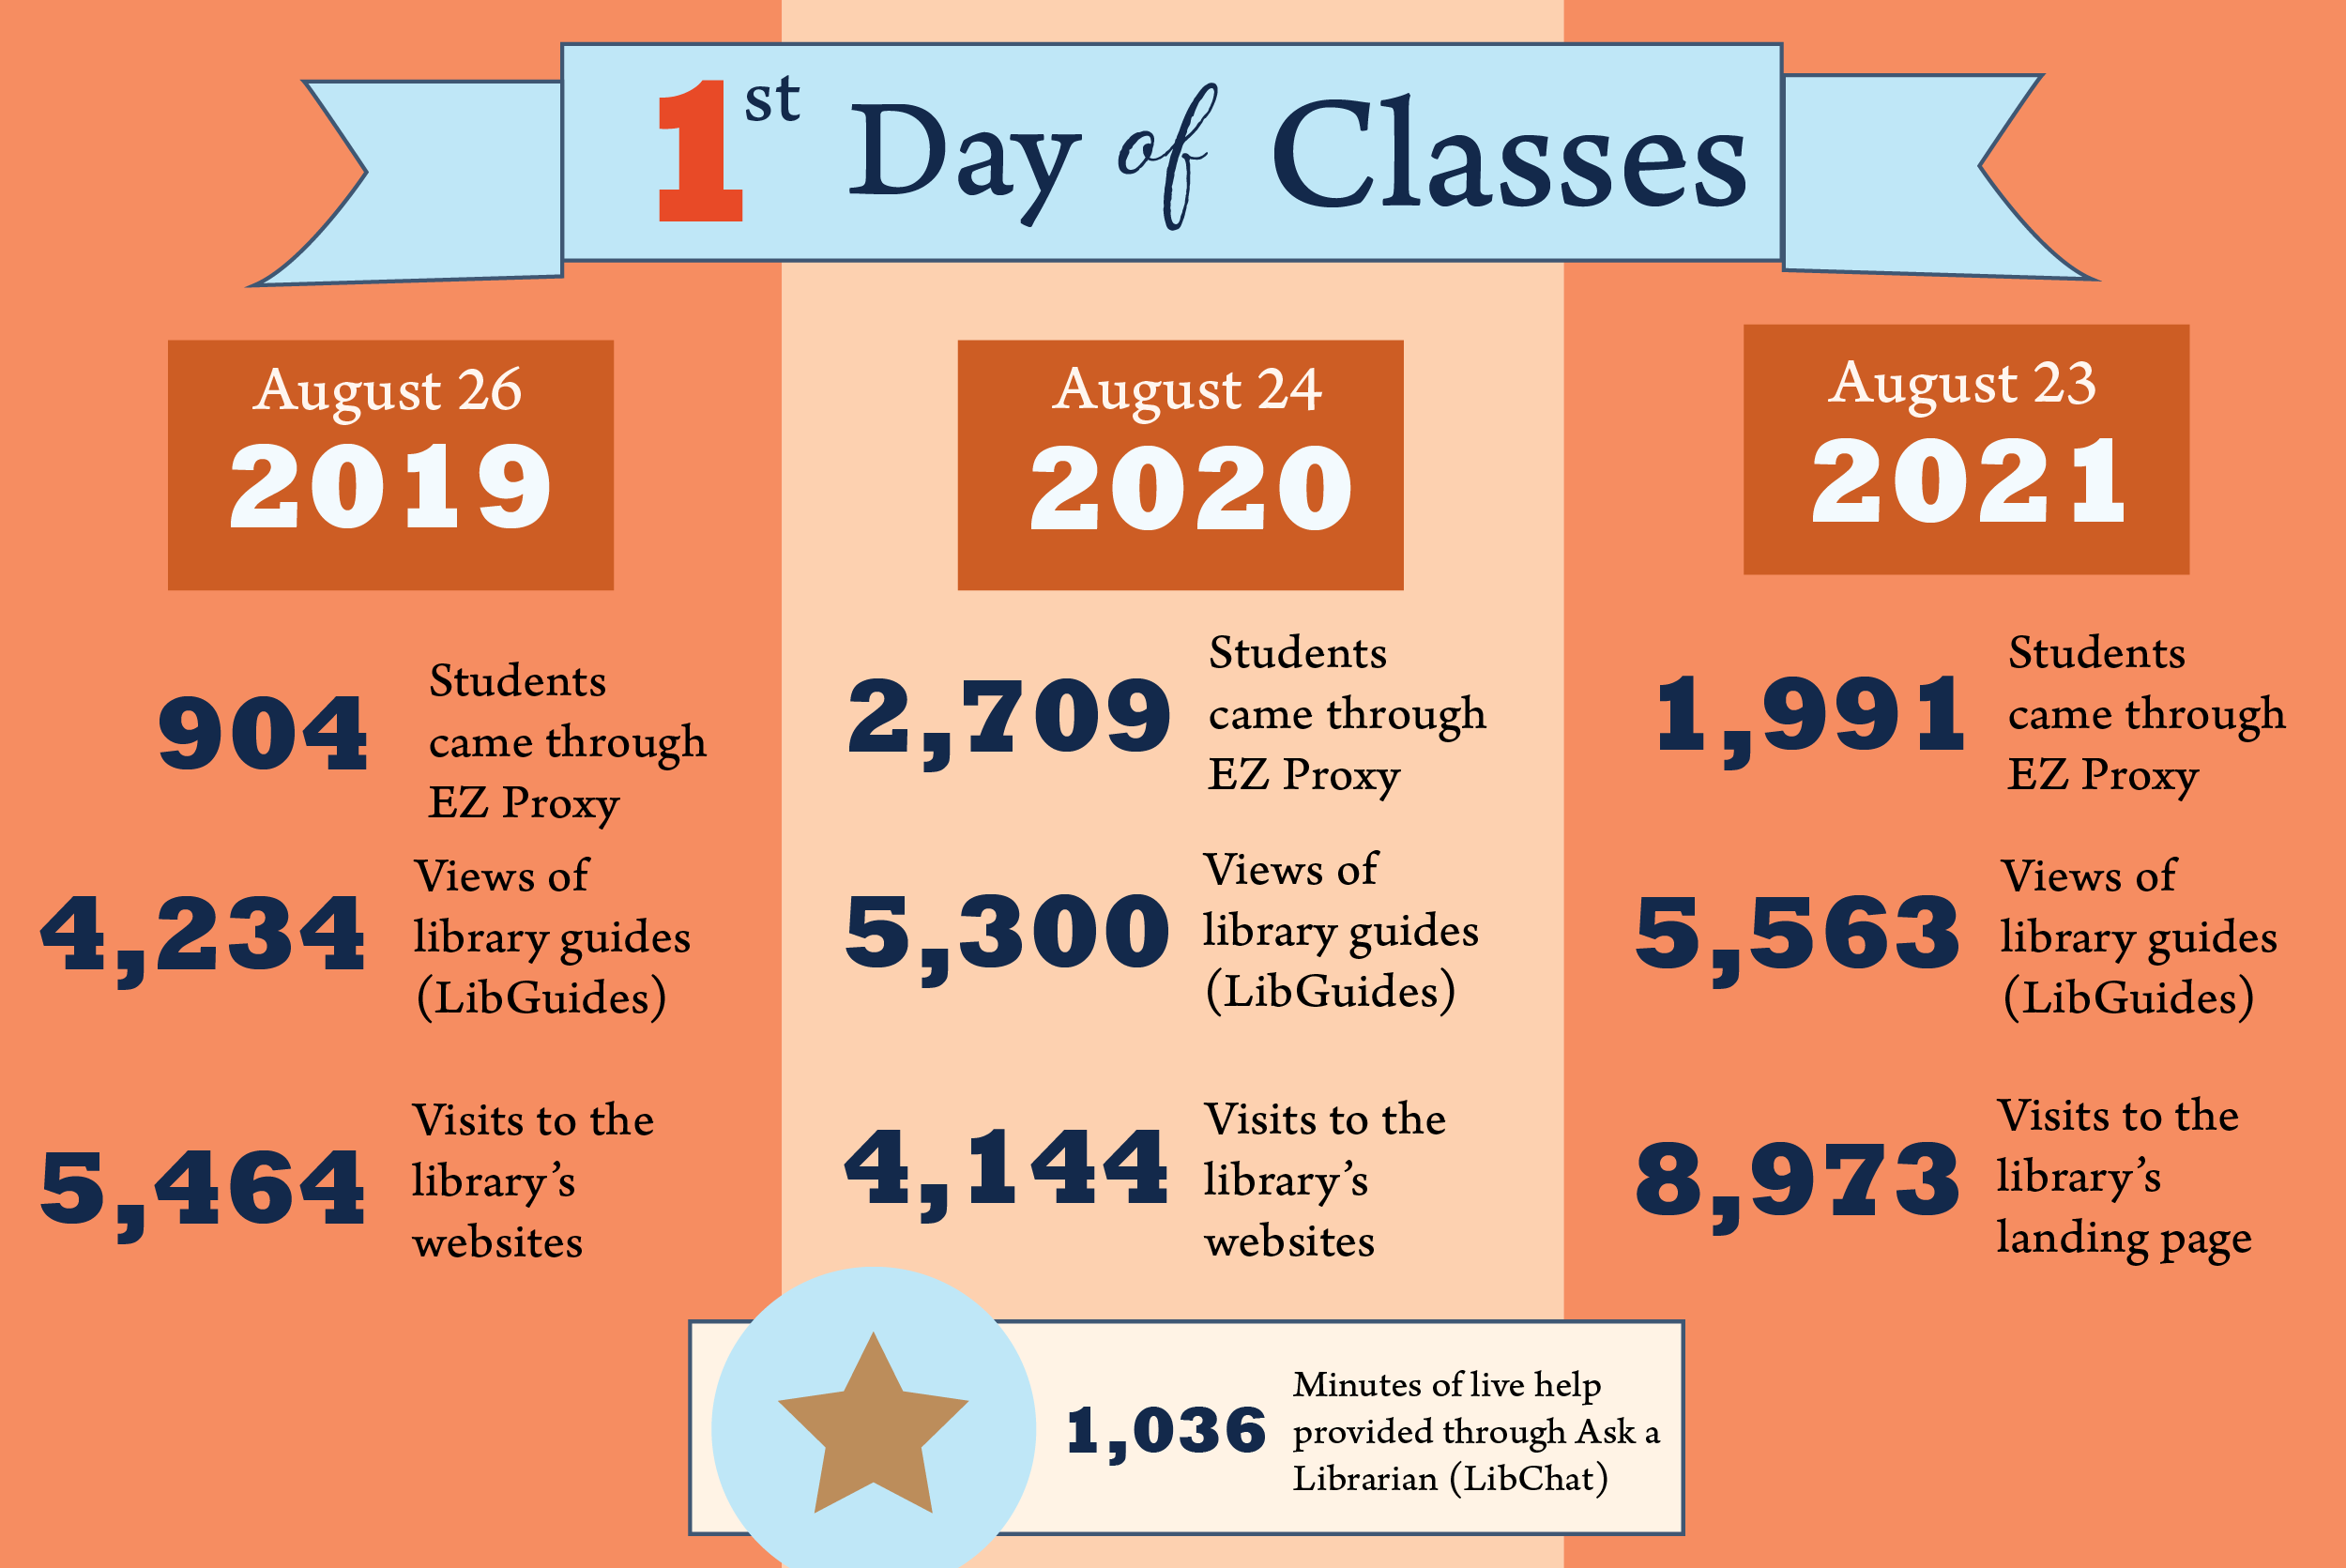
In September 2020, Library Assessment created a “first day” factoid to show user engagement with the Library while operating with a hybrid service model. Revisiting those “first day” statistics continues to show new engagements when the fall 2021 semester started. As expected, 2020 saw a significant increase in the use of online services and electronic resources (EZ Proxy, LibGuides, and LibChat). However, use of those services hasn’t dropped to 2019 numbers even though in-person library services are more accessible.
A note about the data: these metrics and data collection methods have also undergone changes within the past three years, leading to new data points and also estimation of some historical ones. The 2019 LibGuides visits are based off monthly counts divided by the number of days that received visits. The method of measuring engagements to the library’s websites has moved from Google Analytics Universal to Google Analytics 4.
Shout out to John Laskowski for providing website usage stats on demand!
September 2021

Since September 2019, the Library has been using Splunk (a large-scale data analysis tool) to process EZproxy logs in order to record the aggregate use of electronic resources by off-campus users. As we approach September 2021, a few trends can be seen in the data over the past two academic years. Off-campus resource use tends to peak in the middle of the Fall and Spring Semesters, especially for undergraduate and graduate students. Staff and faculty also see a higher rate of off-campus resource usage during this time, but generally remain static users throughout the year. Off-campus resource use has generally remained higher after March 2020, when alternative online course delivery started due to the COVID-19 pandemic. Immediately after alternative delivery started, April 2020 saw a peak for undergraduate and staff users. Graduate students and faculty exceeded their April 2020 use in March 2021.
Notes: In January and November 2020 there were some issues with Shibboleth that affected data accuracy in Splunk. As a result, the numbers of faculty and staff users during those two months were estimated (shown in dotted lines).
Interested in more EZproxy off-campus library resource use data? Check out these previous factoids:
- February 2020: Percentage of Students Using Off-Campus Resources by College in Fall 2019
- March 2020: Percentage of Student Off-Campus Use by College in Fall 2019
- April 2020: Daily EZproxy Transactions from January 2020 to March 2020
- June 2020: Comparing Percentages of Student Off-Campus Resource Use in Fall 2019 and Spring 2020
August 2021
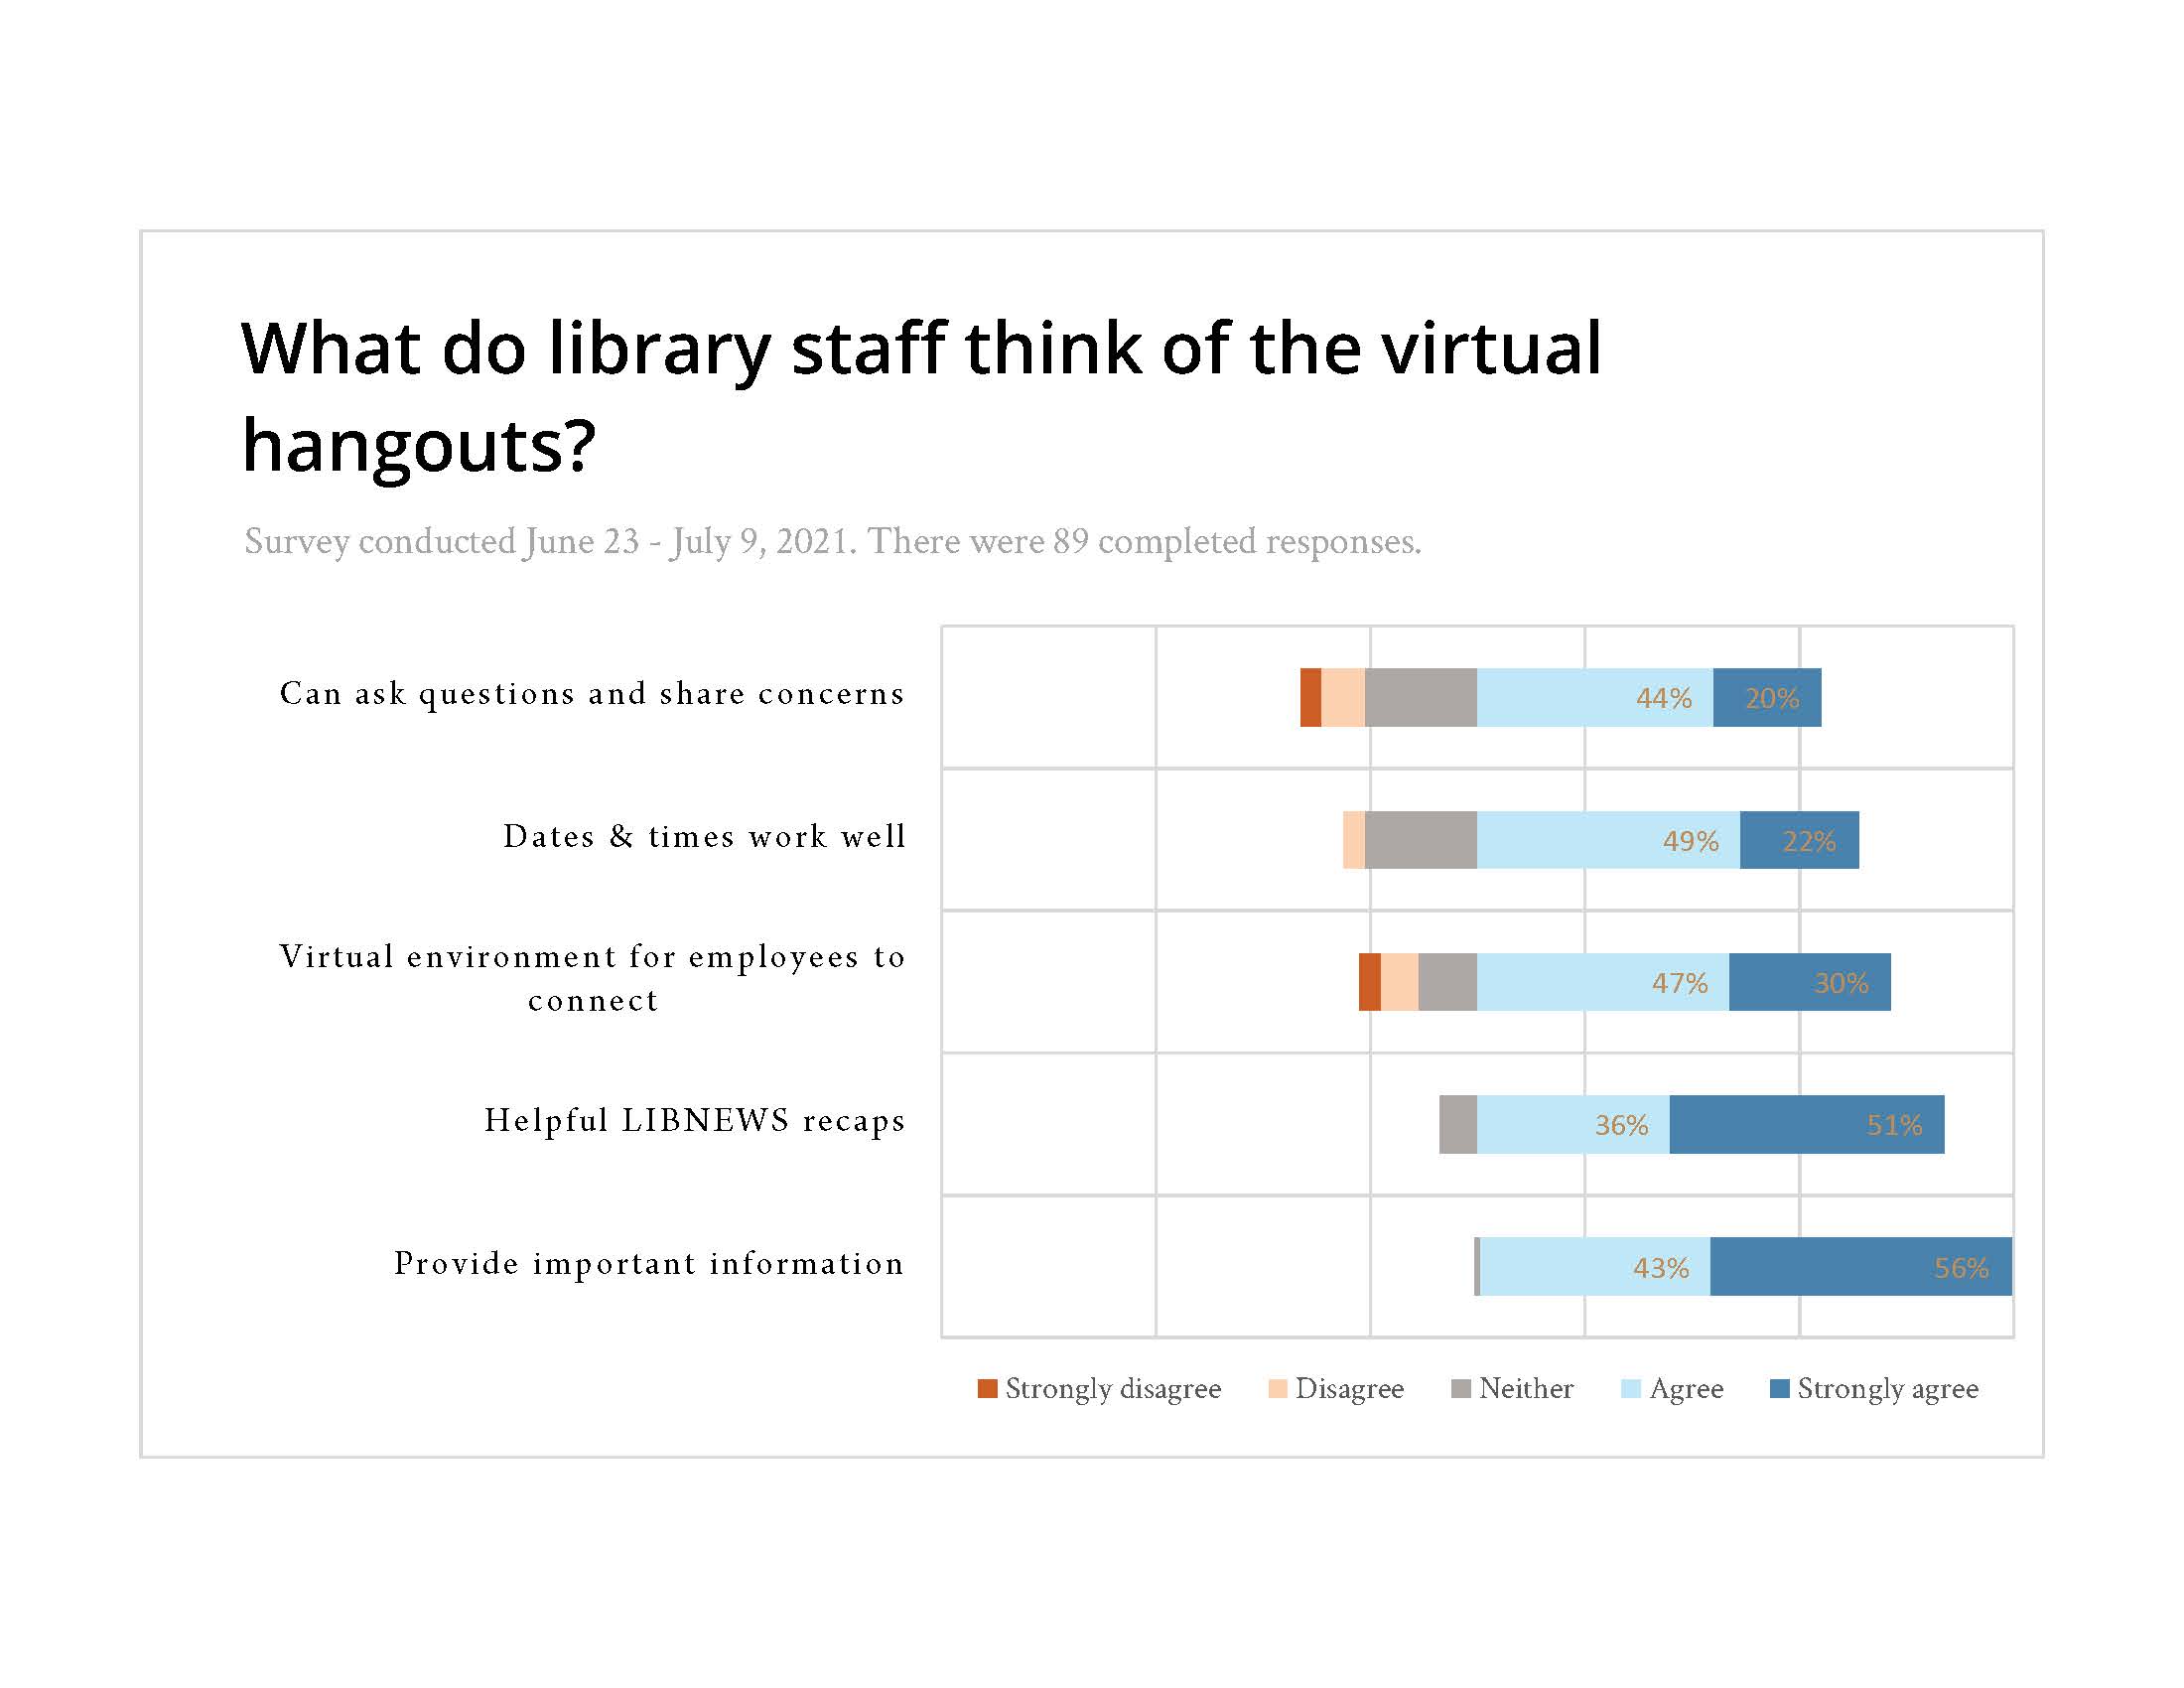
- 86% of staff are always or often attending Hangouts.
- Almost half (47%) never watch the recordings.
- Almost all (99%) strongly agree or agree that Hangouts provide important information.
- 77% strongly agree or agree that Hangouts provide a virtual environment for employees to connect.
- 87% strongly agree or agree that recaps shared via LIB-NEWS have been helpful.
There were 33 comments to improve Hangouts (from 58.9% of survey takers). Here are a few:
- Hangouts seem targeted to faculty; make relevant to civil service and grad students.
- Is there a way to submit topics in advance?
- Send an agenda beforehand; share documents to be discussed ahead of time.
- Assign someone to watch the chat as Qs sometimes get lost.
- More notice for Hangouts.
- More on what other committees are doing or a team or group spotlight.
- Provide community guidelines or chat etiquette.
- Consider adding structured social time or more informal discussion.
Stay tuned for more on improving future monthly Hangouts.
Graphic created by Jen-chien Yu. Text written by Heather Murphy.
No factoid published in July 2021.
June 2021
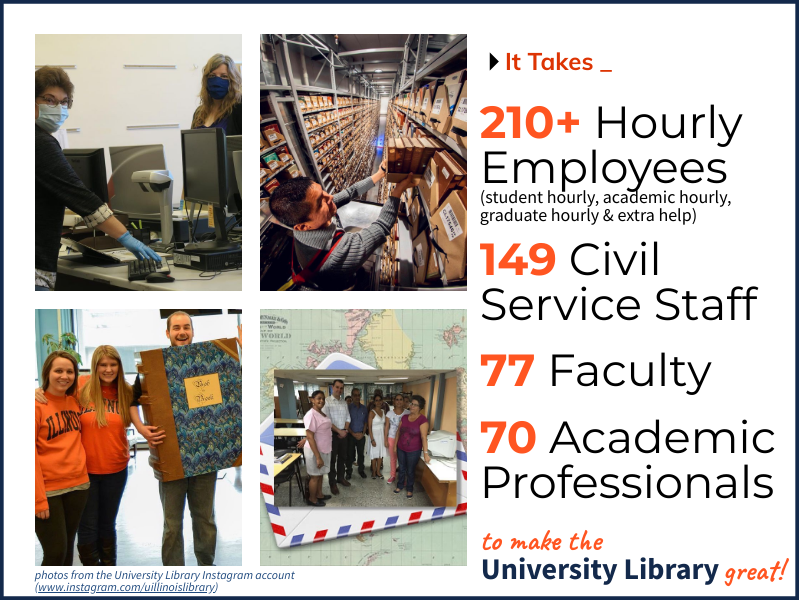
Data from the Division of Management Information 2020-2021 Campus Profile. Photos from the University Library Instagram account.
May 2021
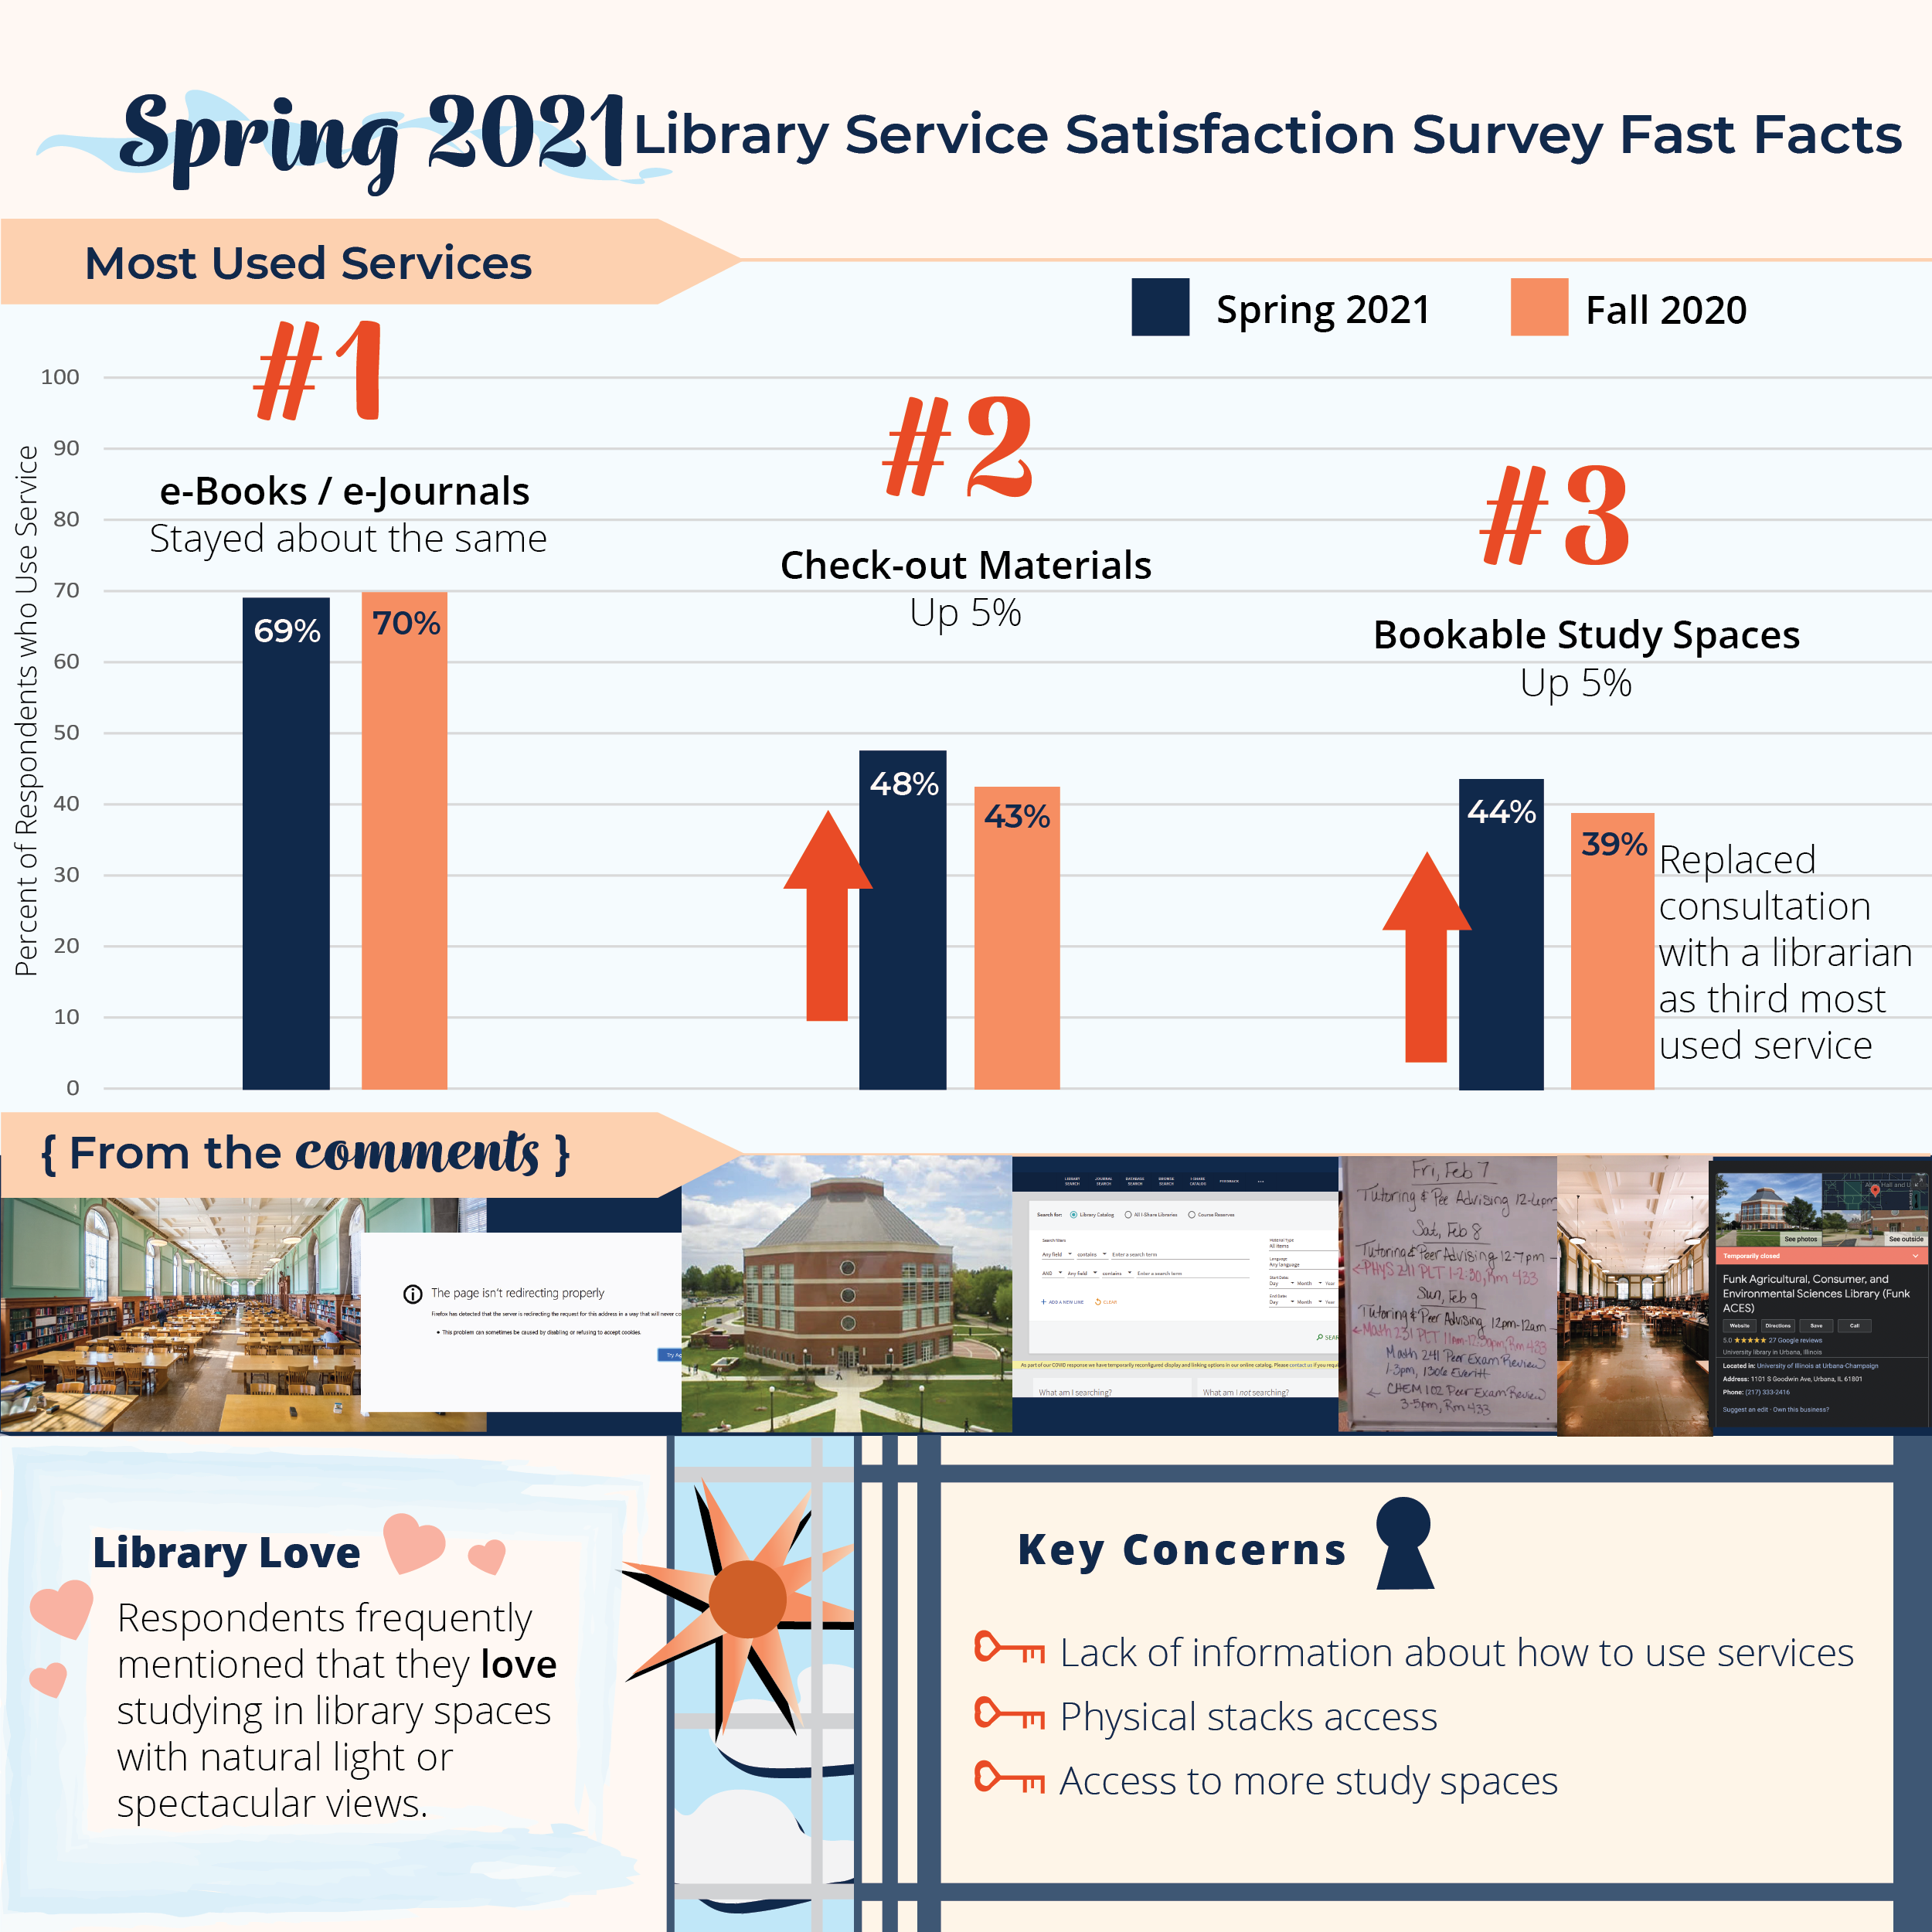
During March 2021, Library Assessment sent out the third short Library Service Satisfaction Survey, the last in a series this academic year started in October 2020 and November 2020 to assess students’ needs and attitudes towards library services during the pandemic. Among 130 responses, the most used services remained similar to what we saw in our first survey with e-book/e-journal and materials checkout being the most frequently used services (see the November 2020 factoid). However, as hours and opportunities for bookable study spaces have increased in Spring Semester 2021 (especially in response to concerns from the first round of surveys), bookable study space became the third most used library service. This time we also gave students the opportunity to upload a photo related to their perspective of the library and give it a related caption. We feature photos received in our survey in this factoid above. Respondents frequently commented that they enjoyed taking a break from studying in the library by looking out the window at campus views and enjoyed the natural lighting. Three main areas of concern have remained a theme in the survey responses also: lack of information about how to access library resources (“[I] am not fully aware of what is available or how to use it”), open physical stacks access, and more study spaces, especially for collaborative use.
April 2021
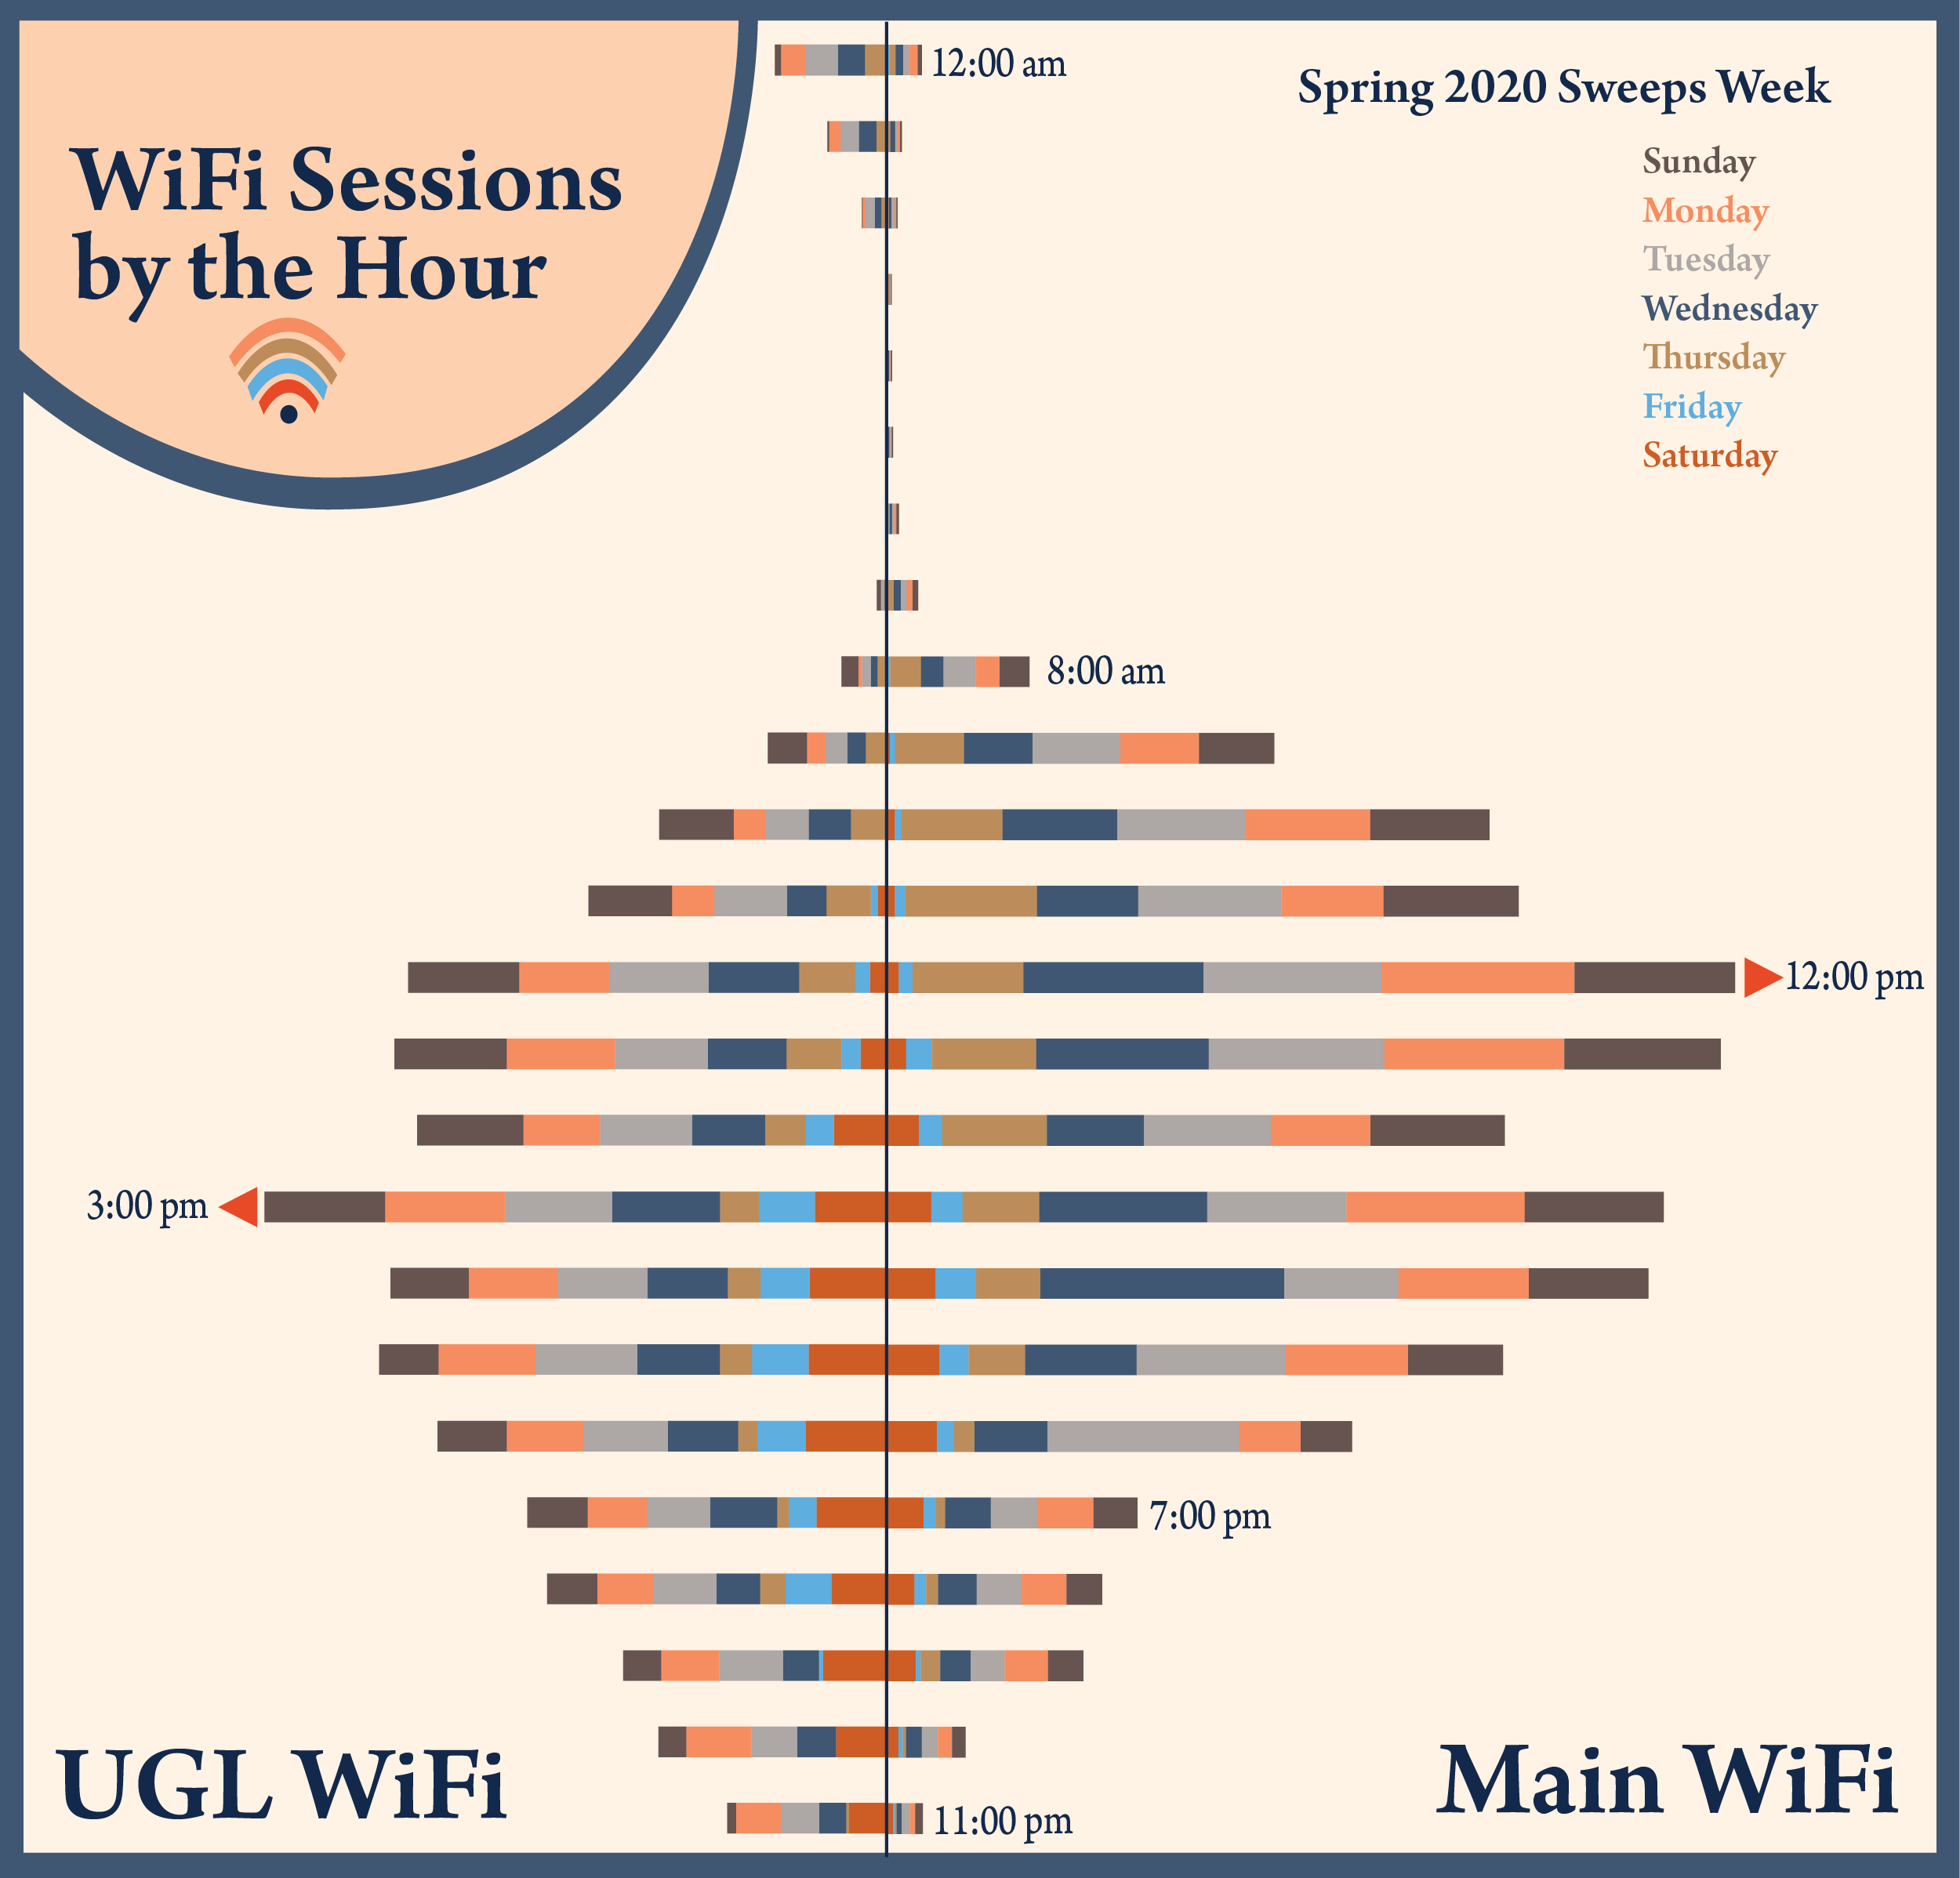
With the upcoming integration of the Undergraduate Library (UGL) into the Main Library, we have been looking deeply into the data to find what our users need in a new library space. Part of this examination has been analyzing quantitative traffic data: head counts, gate counts, and Wi-Fi sessions. What is the expected capacity when two spaces are merged? Looking at pre-Covid Wi-Fi data collected during the Spring 2020 Sweeps Week, the Main Library is typically busy in the morning and that UGL is busier in the afternoon—sustaining head counts and Wi-Fi sessions even late into the night. The highest number of Wi-Fi sessions in a single hour at UGL is 820 sessions on Sunday at 3:00 p.m. and, at the Main Library, is 1,691 sessions on Wednesday at 4:00 p.m.. Throughout the week, UGL sees its peak Wi-Fi counts at 3:00 p.m. while Main has more counts during the week in the 12:00 p.m. window.
As the qualitative side of this data, undergraduate students in recent library focus groups revealed their library experience, providing answers for why does the Wi-Fi peak at 3:00 p.m.. Most participants reported that they like to use the library for study space after class, ranging from quiet solo or comfortable-volume collaborative study. Others talked about using the library as their space outside of their dorm/home, work, and class. While the Main Library has a more utilitarian vibe where one goes to checkout specific materials or expects “traditional” library experiences, the UGL is more a destination where one can collaborate, study, browse the open stacks, and meet up with friends. Students who contributed to the study would like to see more spaces for individual quiet use, but also for collaboration, as well as knowing in advance if there was a quiet or collaborative seat available for them at peak times.
March 2021
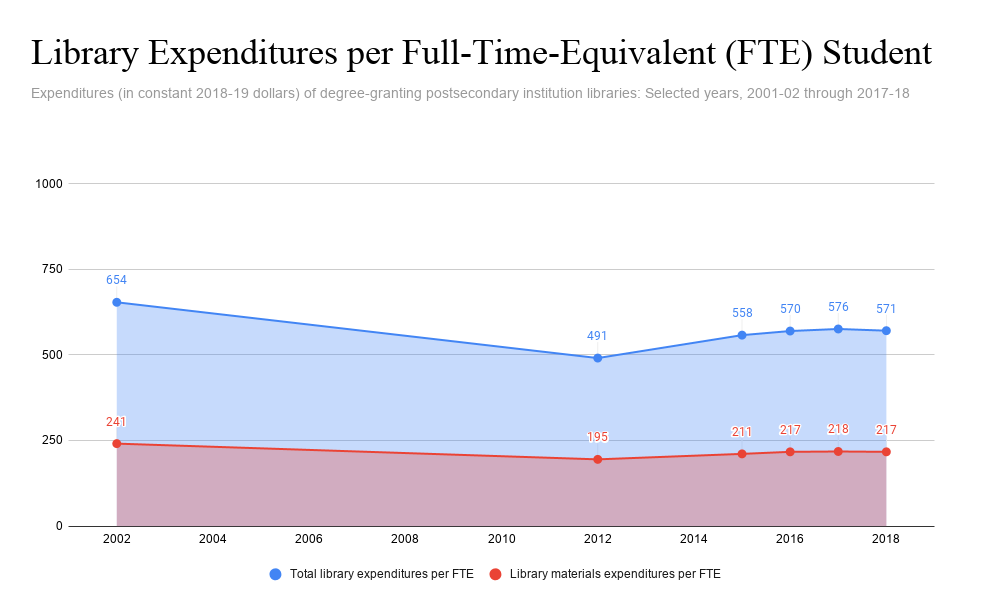
The “Digest of Education Statistics, 2019” was published by the National Center for Education Statistics (NCES) this month. It contains the most recent statistical information regarding universities and libraries. The Digest examined library expenditures at degree-granting postsecondary institutions across the United States and found total library expenditures (including salaries and wages, materials, and other operating expenditures) per FTE were 25 percent lower in 2011-12 ($491, in 2018-19 dollars) than in 2001-02 ($654, in 2018-19 dollars). Total library expenditures per FTE slightly increase from 2011-12 to 2017-18, however, they were still 13 percent lower in 2017-18 ($571) than in 2001-02. Library materials expenditures, which include one-time (books, backfiles, etc.), ongoing (serial and electronic resource subscriptions), and other expenditures for collection support, showed a similar trend during the same time period. Library materials expenditures per FTE were 19 percent and 10 percent lower in 2011-12 and 2017-18 than in 2001-02, respectively.
More information is available at https://nces.ed.gov/programs/digest/d19/.
February 2021
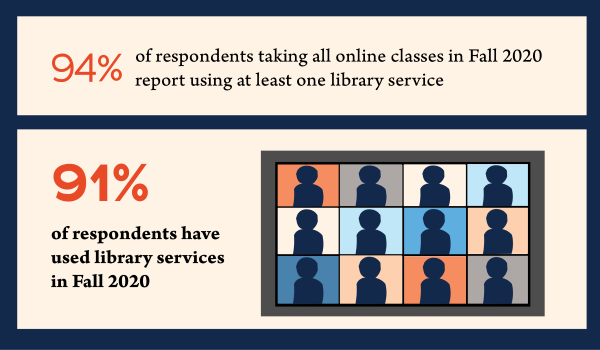
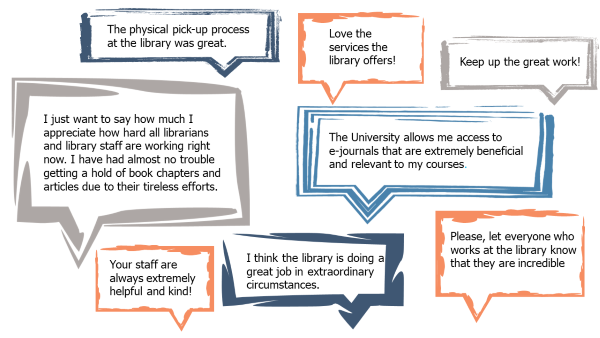
In October and November 2020, 315 students responded to a Library Service Satisfaction Survey. 91% of the respondents have used library services. Most used services identified by the respondents are e-books/e-journals, checking out a book/equipment, consultation with a librarian, and bookable study spaces. Library services are important for students who are fully remote – 94% of respondents who took all classes online, as well as 93% of respondents who lived outside of the Champaign, Urbana and Savoy areas, have used library services in Fall 2020.
While there are many challenges providing library services during the pandemic, many respondents shared their appreciation to the Library and library staff. The image below highlights a few encouragement and thank-yous submitted by the respondents.
December 2020
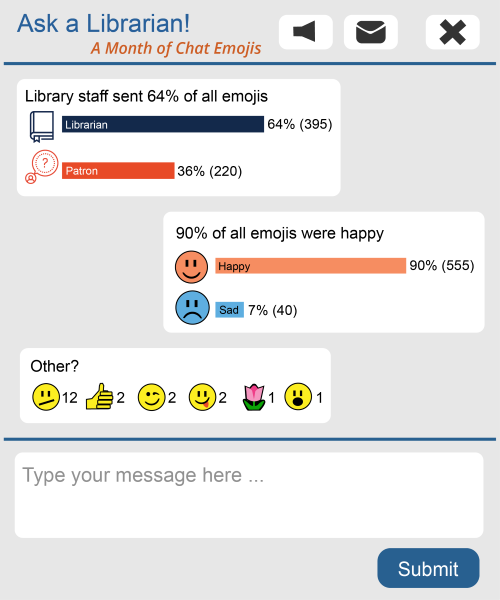
From the first day of class to the start of fall break, the Ask a Librarian (LibChat) virtual reference service has answered 3,791 questions from students, faculty, and the broader user community. In those conversations over LibChat, there were feelings of frustration, encouragement, gratitude, and more – and they were sometimes expressed with the use of emojis. Using emojis during a live chat can add a human touch to online conversations, help patrons feel more at ease, and improve the overall user experience. Take the September chats as an example – 615 emojis were found in the chat transcripts and 64% of the emojis were sent by the Library staff. 🙂
November 2020
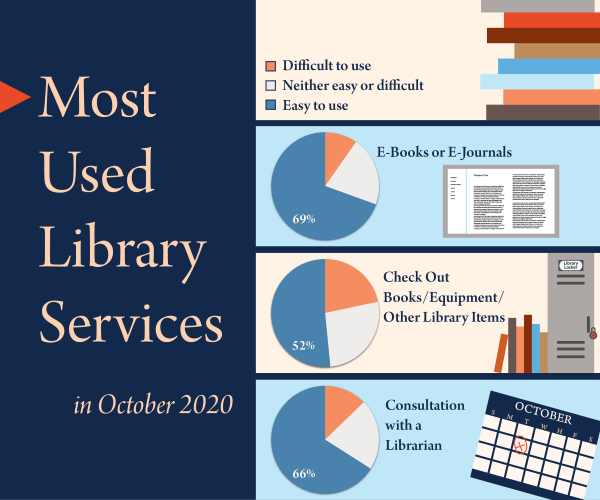
In October 2020, the first of two short library satisfaction surveys was circulated among randomly selected undergraduate, graduate, and professional students. The goal of the survey was to assess the students’ needs and attitudes with respect to the services and resources offered by the University Library during the pandemic. In the survey, students were asked to rate eleven library services (i.e., study spaces, checkout items, librarian consultation) as easy, neither easy or difficult, or difficult to use. Students were also given an option to select that they have never used the service. Of the 215 responses, three of the most used services were e-books or e-journals (72% of respondents have used), checking out books, equipment, or other library items (45%), and consultation with a librarian (44%). Of those who have used each service, 69% of respondents selected that e-books or e-journals are easy to use, 52% selected that checking out library items is easy to use, and 66% selected that the consultation with a librarian service is easy to use. The second of this survey series will be sent in November to a different population of students. The comments from this survey have already revealed key areas of improvement for making the library’s services more easily accessible to students during the pandemic.
October 2020
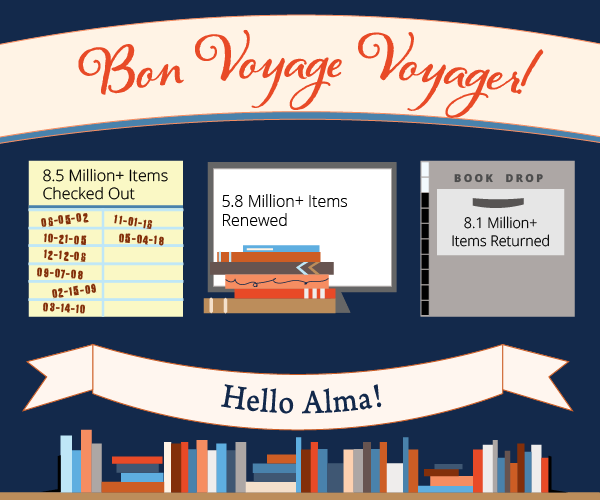
The library started using Voyager as the integrated library system in April 2002. On June 24th, 2020, we said goodbye to Voyager, along with VuFind and Classic Voyager (WebVoyage), and welcomed Alma and Primo. During the past 18 years, millions of transactions were processed using Voyager. Looking at the circulation statistics alone, there were more than 8.5 million initial checkouts, 5.8 million renews, and 8.1 million returns recorded in Voyager. That equals to 1.2 million circulation transactions per year and an average of 2 transactions per minute.
We thank you for your service, Voyager. Bon Voyage!
Thanks to Michael Norman, Janelle Sander, Cherie Weible, and Heather Murphy for providing data and consultation. Image created by Library Assessment Graduate Assistant Lindsay Taylor.
September 2020
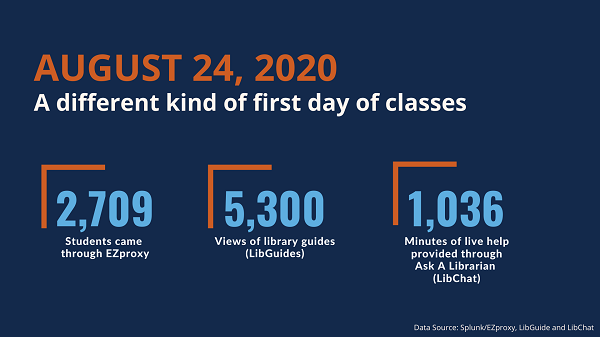
This year’s first day of classes for the fall semester, August 24, 2020, was far different than any other first day that the university has had. There were no long lines at the coffee shops, and no one asked where Room 66 was or where they could print out class schedules. While it was quiet in library buildings and spaces, library services were busy at work, serving faculty, staff, and students who were on or away from campus. Here is what happened in the Library (virtually) during the first day of classes.
August 2020
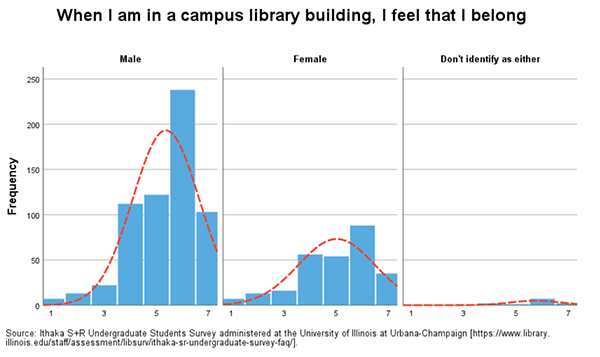
In a survey conducted in Fall 2018, the library asked 974 undergraduate students to indicate their level of agreement to this statement “When I am in a campus library building, I feel that I belong” using a scale of 1 (Strongly Disagree) to 7 (Strongly Agree). The chart below shows how male, female, and students who did not identify with either gender responded to the question.
Male students were more likely to support the statement (n=617, median=6) than female students (n=219, median=5). It is unclear how the “Don’t identify with either” subgroup felt about this statement since it had less than 20 participants. However, understanding and acknowledging the differences in perceptions and needs across all student demographic subgroups is essential during the COVID-19 pandemic and the civil unrest. Several studies of college student experiences during the pandemic have found that underrepresented or marginalized student groups are dealing with a higher level of stress and financial or social worries. For example, a study conducted by the Higher Education Data Sharing Consortium (HEDS)* found that non-binary and female college students felt more stressed and worried about paying for rent or food than male students. Another study conducted by Ithaka S+R** revealed a similar trend about non-binary and female students. The Ithaka S+R report also showed that students lacked a sense of belonging and felt socially disconnected.
*HEDS COVID-19 Institutional Response Surveys
**Student Experiences During the Pandemic Pivot
July 2020
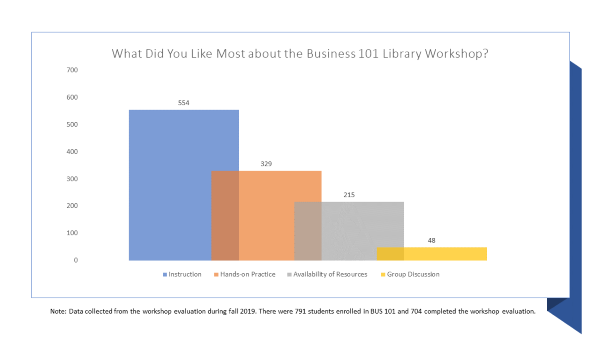
Business Information Services (BIS) has been providing the Business 101 Library Workshop to students who enroll in BUS 101 (Professional Responsibility and Business), a 3-credit course and a core requirement for business majors. In Fall 2019, BUS 101 instructors required all their students to complete the Workshop. 704 students (out of 791 who enrolled) completed an evaluation after attending the Workshop. 66% of those students (n=464) ranked the Workshop “Very Good” and identified the elements they liked the most: Instruction, Hands-on Practice, and Availability of Resources. In addition, a comparison of BUS 101 course grades from Fall 2018 (students were not required to complete the Workshop) found that the students from Fall 2019 had higher grades (t test results).
June 2020
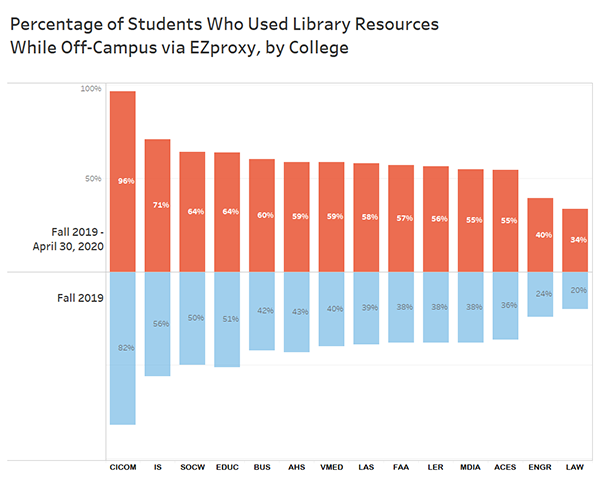
After the campus closed and all classes resumed online on March 23rd, the use of the Library’s EZproxy and electronic resources by all user groups, particularly by the students, has increased. More than 36,000 students have accessed the EZproxy server since September 2019. The chart below compares the percentages of students who accessed the EZproxy, using aggregated data from the fall semester (blue bars) and both fall/spring semesters (orange bars). The percentages were increased for all colleges, most notable for Fine + Applied Arts (FAA), Liberal Arts Sciences (LAS) and Vet Med (VMED).
May 2020
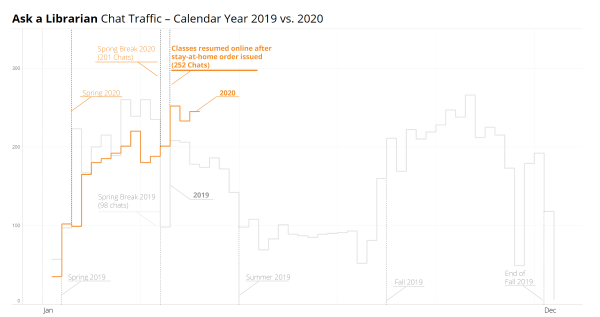
While all University Library locations are closed to the public in accordance with the “stay-at-home” order, the Ask a Librarian virtual reference service continues to support students, faculty, and the broader user community. Data show that the Ask a Librarian service answered 201 chats during spring break 2020 (March 14-22) – a 100% increase compared to spring break 2019. During the first week after classes resumed online (March 23), the Ask a Librarian service answered 252 chats, which marks the busiest week since October 2019.
April 2020
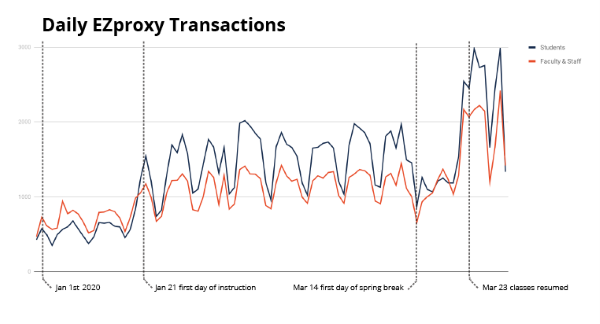
Usage of library electronic resources has increased after the university began alternative online course delivery. Based on the year-to-date data, the highest daily transactions by faculty/staff and students were both recorded on Monday, March 30th. There were 2,989 EZproxy transactions initiated by Illinois students and 2,419 transactions initiated by Illinois faculty and staff.
March 2020
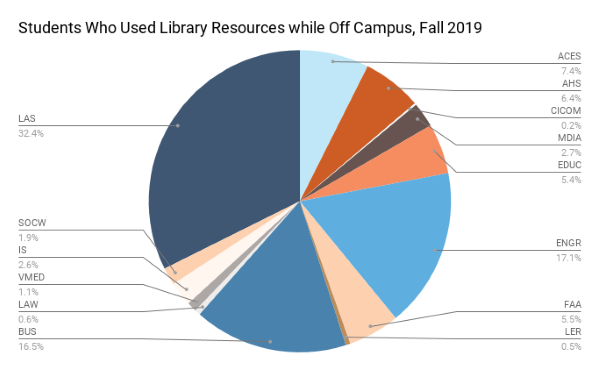
Since September 2019, the Library has been using Splunk (a large scale data analysis tool) to process EZProxy logs in order to record the aggregate use of electronic resources by off-campus users. From September to December 2019, 33% of faculty, as well as 32% of students, have accessed the library resources from off-campus. The chart below shows that during the same time period, 32.4% of the off-campus student logins were initiated by the College of Liberal Arts and Sciences (LAS) students, 17.1% by the Grainger College of Engineering (ENGR) students, and 16.5% by the Gies College of Business (BUS) students.
The data analysis and visualization of usage logs would not be possible without extensive work by the Library IT, especially Jon Gorman and Jason Colwell.
February 2020
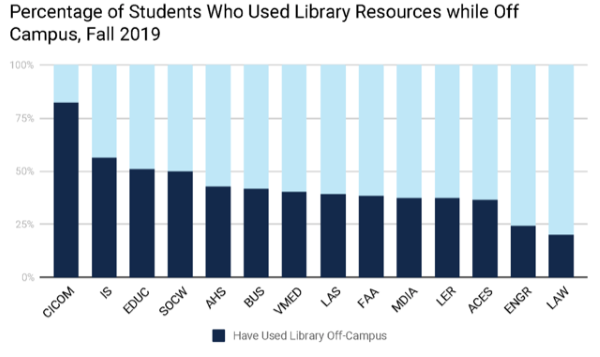
Since September 2019, the Library has been using Splunk (a large scale data analysis tool) to process EZProxy logs in order to record the aggregate use of electronic resources by off-campus users. From September to December 2019, 33% of faculty as well as 32% of students have accessed the library resources from off-campus. The graph below shows the percentage of students who accessed resources from off-campus for each college. The top colleges/schools are the Carle Illinois College of Medicine, iSchool, the College of Education, and the School of Social Work.
The data analysis and visualization of usage logs would not be possible without extensive work by the Library IT, especially Jon Gorman and Jason Colwell.
January 2020
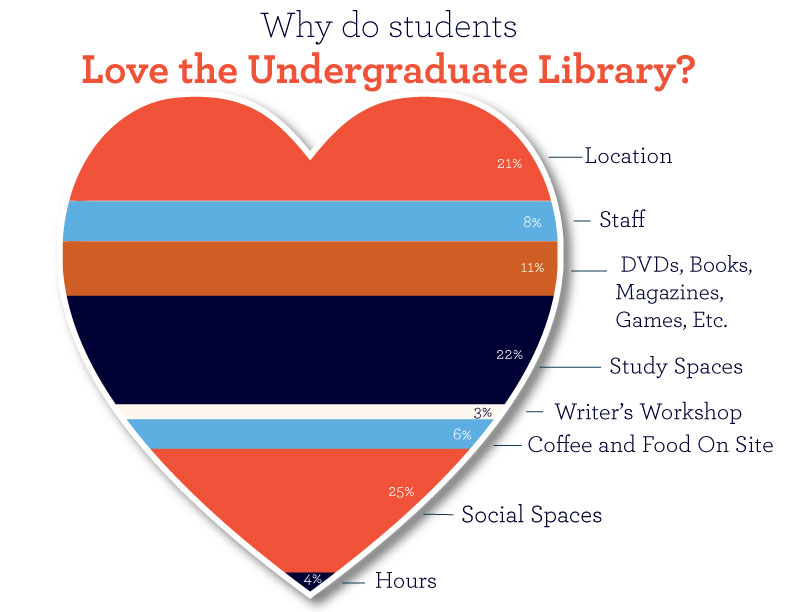
As part of the Undergraduate Library’s 50th Anniversary celebration, we asked students to write down what they liked about the UGL. Overwhelmingly students said they loved the UGL as a place to be with friends (Social Spaces, 25%) and to study (22%).
December 2019
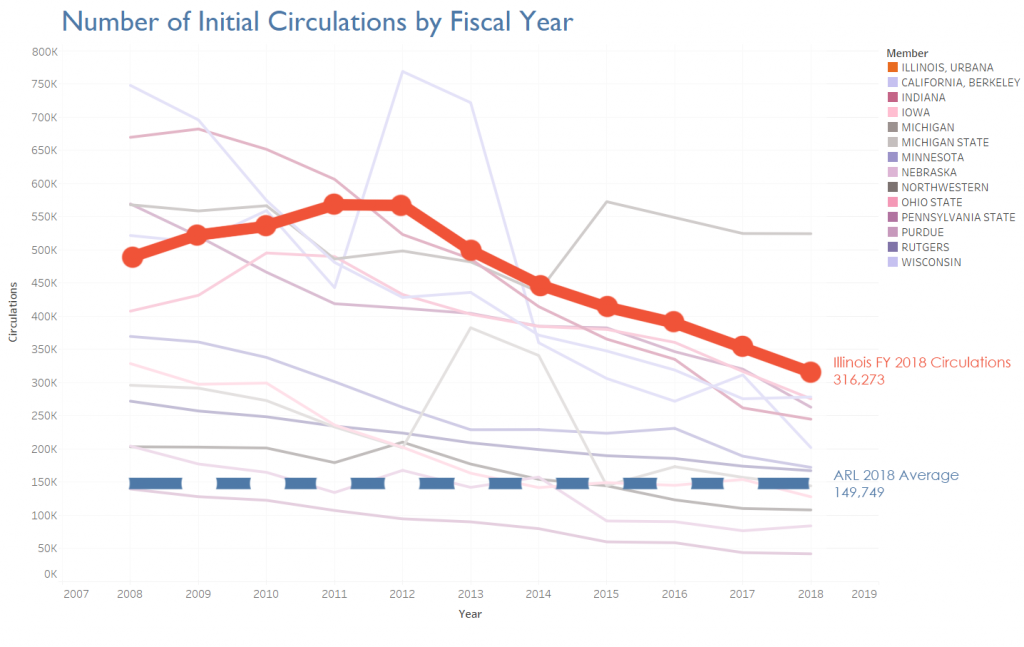
The University Library recorded 322,962 initial circulations during Fiscal Year 2019, which shows a 2% increase from Fiscal Year 2018 (316,273). Academic libraries use “initial circulations,” which does not include reserves and loanable technology or e-book usage, as an important metric to assess the use of a physical collection. During FY18, the Library recorded the second highest number of initial circulations among BTAA libraries (#8 among 116 ARL university libraries).
November 2019
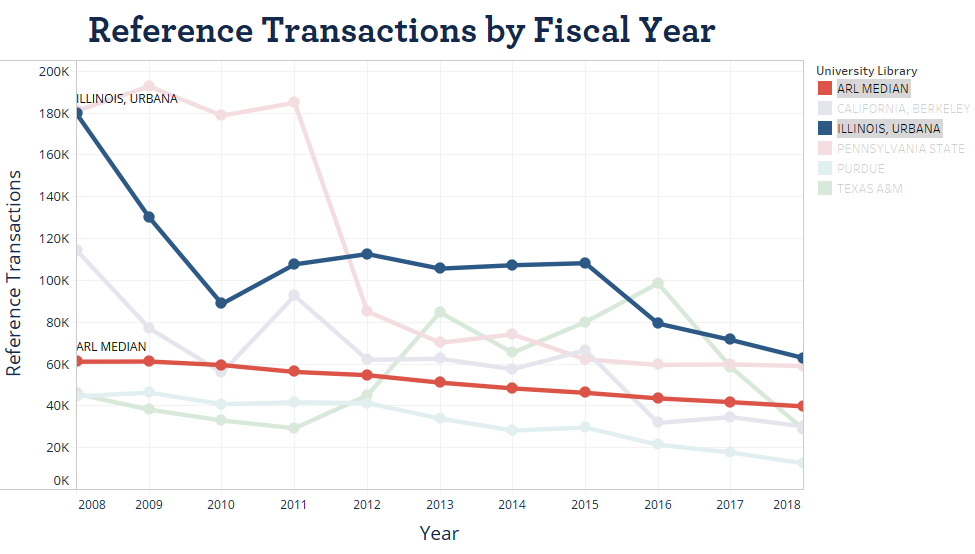
A “Reference Question” is defined as an “information contact that involves the knowledge or use of one or more information sources by library staff” (ISO 2789). While many academic libraries have reported a decline in reference services for the last decade, these continue to be important at the University Library. During the fiscal year 2018, the library provided the most reference and consultation interactions (62,868) among all BTAA libraries and more than many other peer institutions (#14 of 116 ARL university libraries).
October 2019
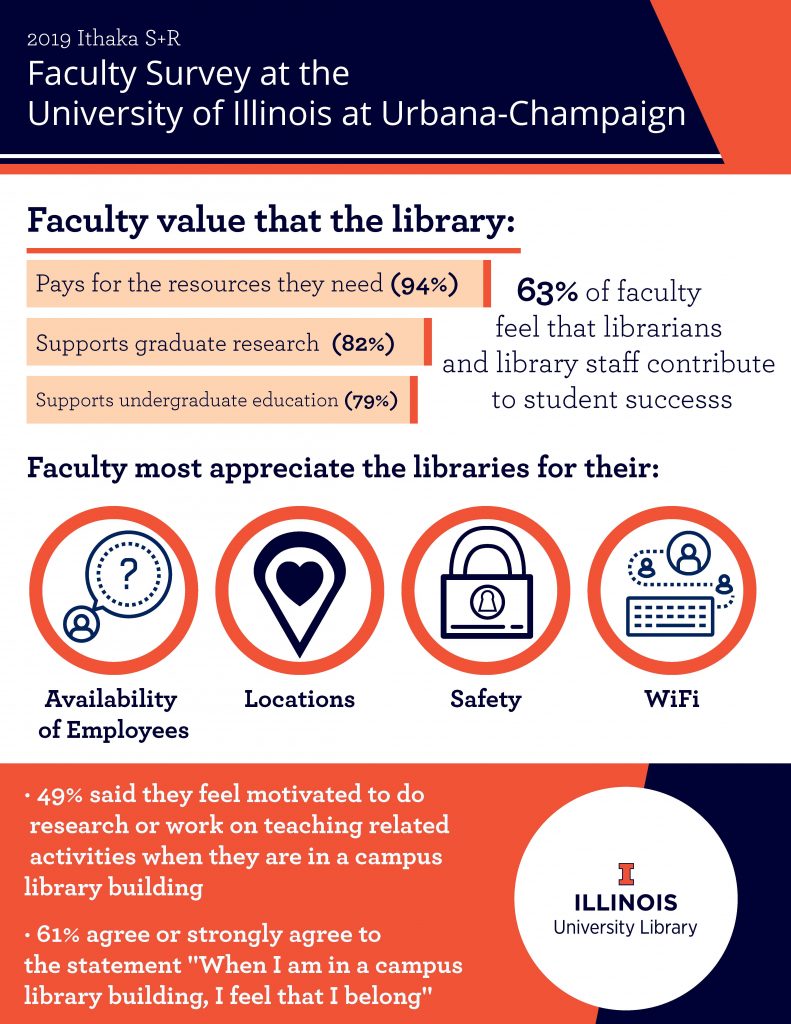
How do Illinois faculty value the University Library and the librarians and staff? The 2019 faculty survey found that 63% of the faculty participated in the survey felt that the librarians and the library contribute to student success. The faculty also highly valued that the library “Pays for the resources they need” (94%), “Supports graduate research” (82%) and “Supports undergraduate education” (79%).
For more information about the survey, please visit https://www.library.illinois.edu/staff/assessment/libsurv/ithaka-sr-faculty-survey-2019-faq/.
September 2019
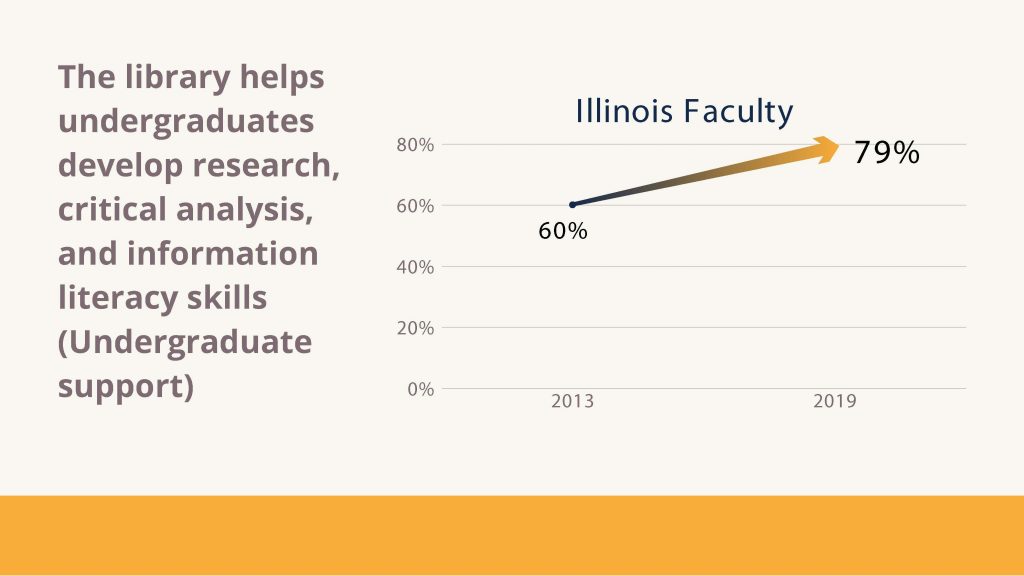
The library conducted a faculty survey in spring 2019 and found a considerable increase (19%) in the importance of undergraduate library instruction. 79% of the Illinois faculty who participated in the survey viewed the function of “The library helps undergraduates develop research, critical analysis, and information literacy skills” to be important/extremely important. In 2013, only 60% of the participants valued the undergraduate library instruction as important.
For more information about the survey, please visit https://www.library.illinois.edu/staff/assessment/libsurv/ithaka-sr-faculty-survey-2019-faq/ .
August 2019
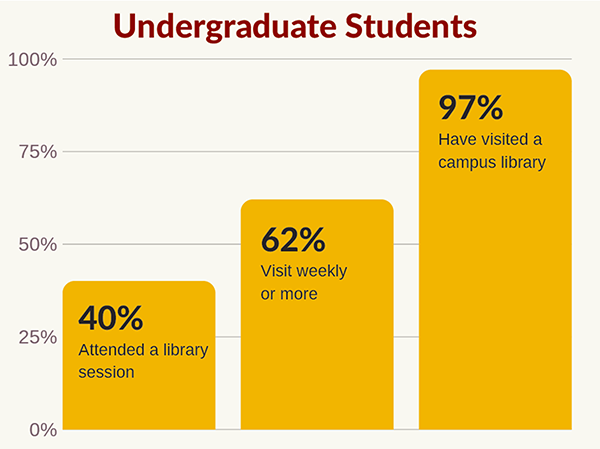
A survey conducted in fall 2018 by the Library shows that 97% of the undergraduate students surveyed have physically visited the library. 42% said they prefer studying/working in a campus library more than in other types of buildings. 52% identified with this statement: “When I am in a campus library building, I feel that I belong.”
For more information about the survey, please visit https://odos.illinois.edu/assessment/pulse/2018/library/ and https://go.library.illinois.edu/undergrad.