Thank you to everyone who participated in our recent pulse survey that closed November 18, focusing on meeting preferences.
We received 139 responses, representing a 49% response rate from current Library faculty, civil service, and academic professionals. The results of this survey have a 90% confidence level with a margin of error of ±6%.
November Survey Questions:
Question 1: What is your preferred meeting mode for collaborative meetings such as committee meetings, working groups, task forces, etc.? Please answer based on your general preferences, not what you’d do in a specific case.
Respondents answered the following ways to the radio button question of “What is your preferred meeting mode for collaborative meetings such as committee meetings, working groups, task forces, etc.?”
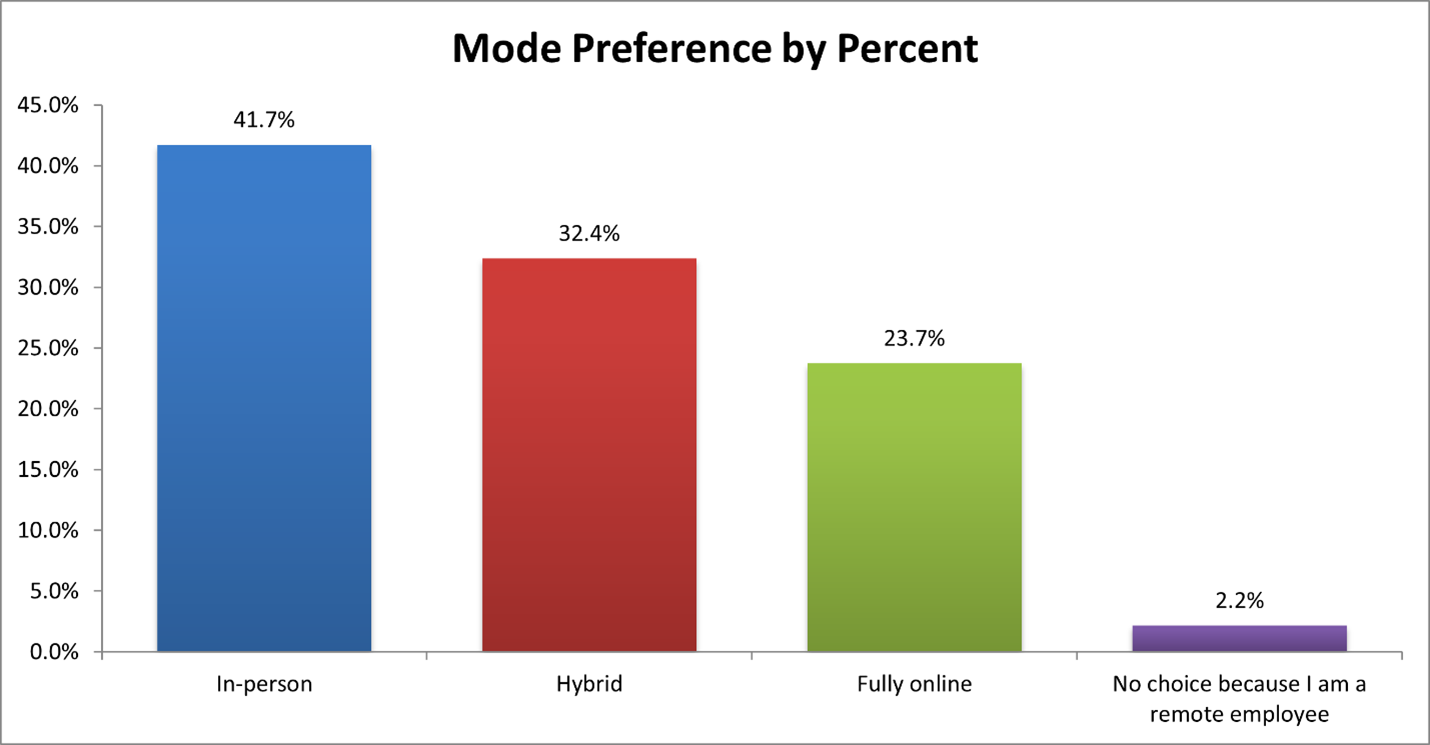
- In-person – 41.7% (58 responses)
- Hybrid – 32.4% (45 responses)
- Fully online – 23.7% (33 responses)
- No choice because I am a remote employee – 2.2% (3 responses)
This chart shows a visual breakdown of Question 1 by mode preference.
Question 2: Please indicate why you chose “In-Person”, “Hybrid”, or “Fully Online”? Choose all that apply.
Respondents who selected In-person, Hybrid, or Fully Online in Question 1 were presented with an optional follow-up question designed to gather additional insight into their modality preference. This item allowed multiple selections from ten predefined options including an ‘Other’ option with an open-text field.
In aggregate, the Question 2 responses from highest to lowest were:
- Easier to engage in this environment – 60.6% (80 selections)
- Team building opportunities; face-to-face conversations – 56.1% (74 selections)
- Fewer distractions and interruptions – 43.2% (57 selections)
- Easier to schedule – 43.2% (57 selections)
- Easier to access meeting documentation and resources – 37.9% (50 selections)
- Desire to be around others – 33.3% (44 selections)
- Other – 21.2% (28 selections)
- I work in a different building – 18.2% (24 selections)
- Use of closed captions and accessible technologies – 15.9% (21 selections)
- Do not have a dedicated workspace – 5.3% (7 selections)
The following chart shows the popularity of Question 2 choices based on whether the respondent initially answered In-Person, Hybrid, or Fully Online in Question 1.
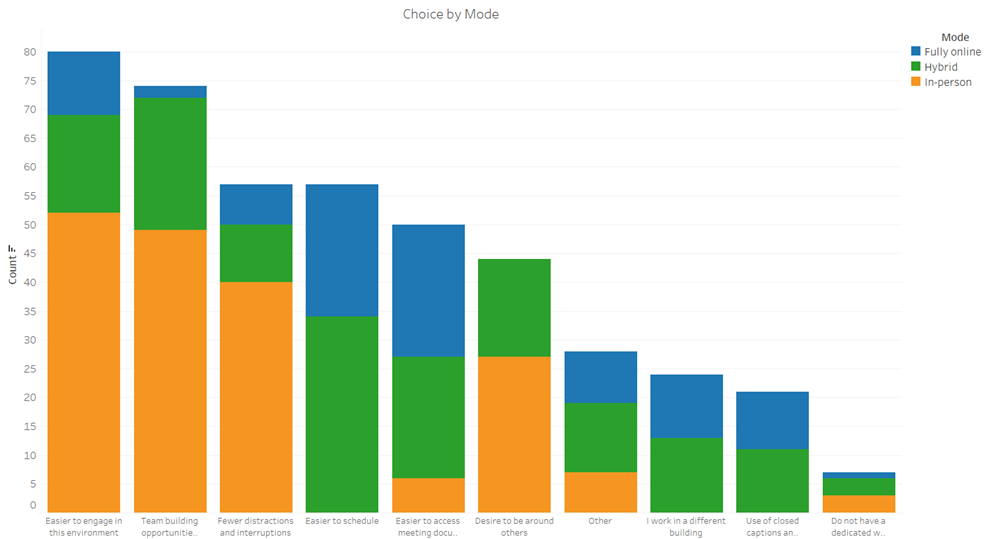
Note: Click for a larger-sized chart of Question 2.
The top 3 reasons for preferring In-person, Hybrid, or Fully Online meetings were:
In-person
1) Easier to engage in this environment (92.9%)
2) Team building opportunities (87.5%)
3) Fewer distractions and interruptions (71.4%)
Hybrid
1) Easier to schedule (77.3%)
2) Team building opportunities (52.3%)
3) Easier to access meeting documentation and resources (47.7%)
Fully online
1) Easier to schedule (71.9%) – tied
1) Easier to access meeting documentation and resources (71.9%) – tied
2) I work in a different building (34.4%) – tied
2) Easier to engage in this environment (34.4%) – tied
In Question 2, respondents had the option to provide write-in text when selecting “Other.” A total of 26 employees chose to do so. Many of these comments added nuance or context to the 9 predefined choices. However, several surfaced distinct themes that may be valuable for those planning and facilitating meetings. Although these comments were very few in number, they represent high-impact needs.
- Virtual meetings may lessen the occurrence or intensity of microaggressions.
- In-person meetings can be preferable for employees who need to limit screen time due to medical reasons.
- Shared or open office environments can make it difficult for employees to contribute verbally to online meetings, particularly when sensitive information is being discussed.
Your feedback is valuable as we continue to improve how we collaborate across the Library. We are currently reviewing the results. As a first step, the Organization Development & Training Advisory Committee will discuss this feedback to develop a short guide of considerations for those planning meetings.